

SocNetV: Social Network Analysis and Simulation for Structural Dynamics Research
Social network analysis (SNA) sits at the intersection of graph theory, sociology, and computational modeling. While many agent-based platforms treat networks as a backdrop for agent interactions, SocNetV (Social Network Visualizer) places the network itself at center stage — offering a dedicated environment for constructing, analyzing, and simulating the structural properties that govern how information, influence, and behavior propagate through social systems.
What SocNetV Is and Why It Matters
SocNetV is an open-source, cross-platform application written in C++ and Qt, designed specifically for social network analysis and visualization. Unlike general-purpose graph libraries (NetworkX, igraph) that require scripting, SocNetV provides an interactive GUI alongside a built-in scripting interface, making it accessible to social scientists and computational researchers alike.
Its relevance to simulation practitioners lies in its dual role: it is both an analytical tool for characterizing real-world network topology and a simulation environment for studying how structural properties evolve under dynamic processes such as random rewiring, preferential attachment, or epidemic spreading.

Core Analytical Capabilities
SocNetV computes the full suite of standard SNA metrics out of the box:
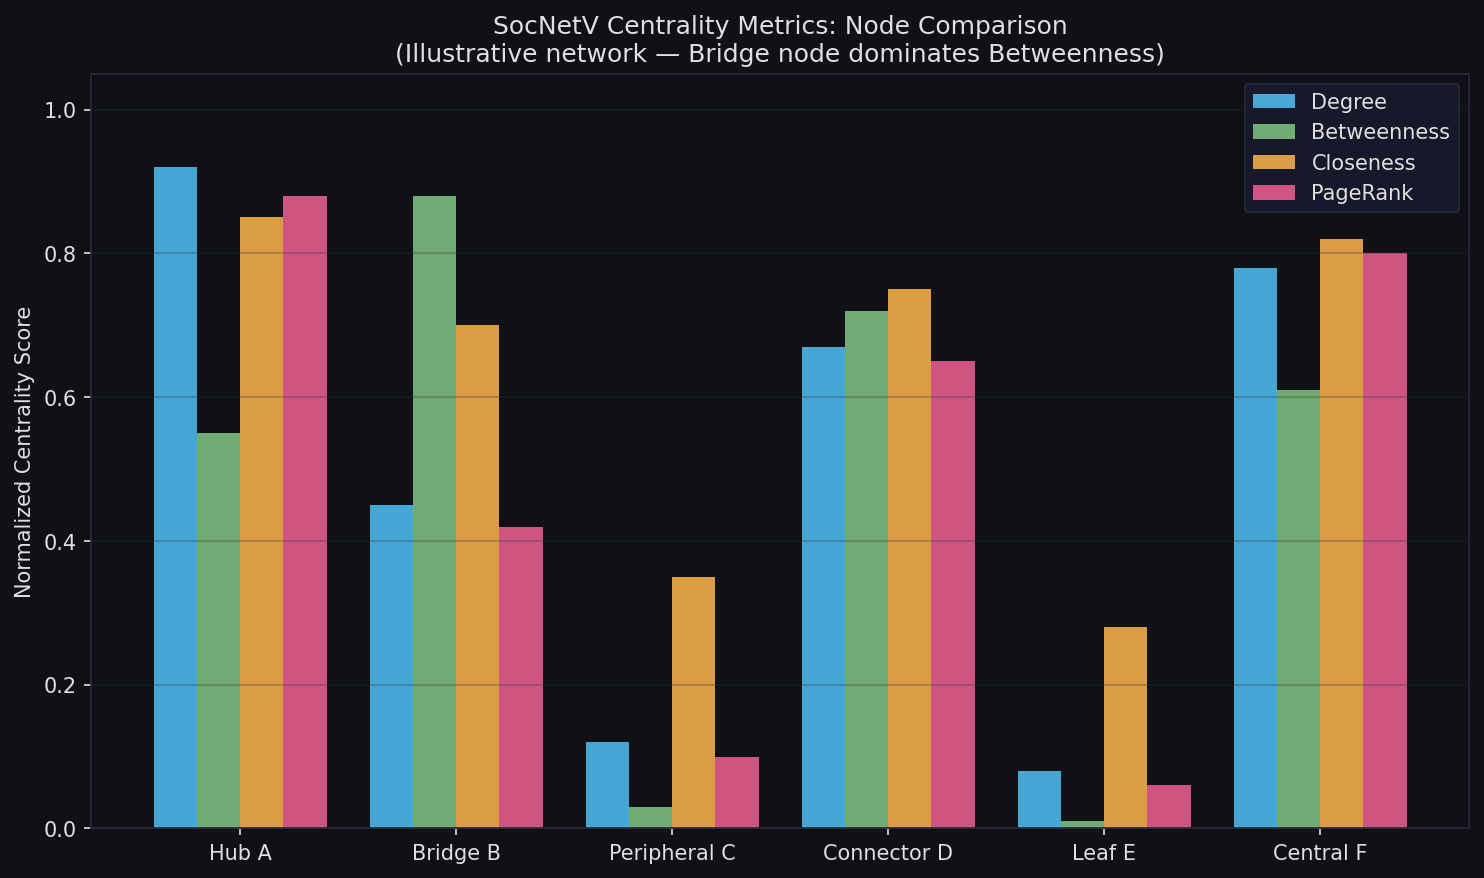
- Centrality measures: Degree, Betweenness, Closeness, Eigenvector, PageRank, and Stress centrality — each available for directed and undirected graphs.
- Clustering and cohesion: Global and local clustering coefficients, graph density, reciprocity, and transitivity.
- Path analysis: Average shortest path length, diameter, eccentricity, and geodesic distance matrices.
- Community detection: Clique enumeration and basic modularity-based partitioning.
These metrics are computed efficiently even for networks with thousands of nodes, and results can be exported to CSV or displayed as ranked node lists within the interface.
Network Generation and Structural Simulation
A key feature for simulation workflows is SocNetV's built-in random network generators:
| Model | Description |
|---|---|
| Erdős–Rényi G(n,p) | Classic random graph with edge probability p |
| Barabási–Albert | Scale-free growth via preferential attachment |
| Watts–Strogatz | Small-world topology with tunable rewiring |
| Lattice / Ring | Regular structured graphs |
| Complete / Star | Fully connected or hub-and-spoke topologies |
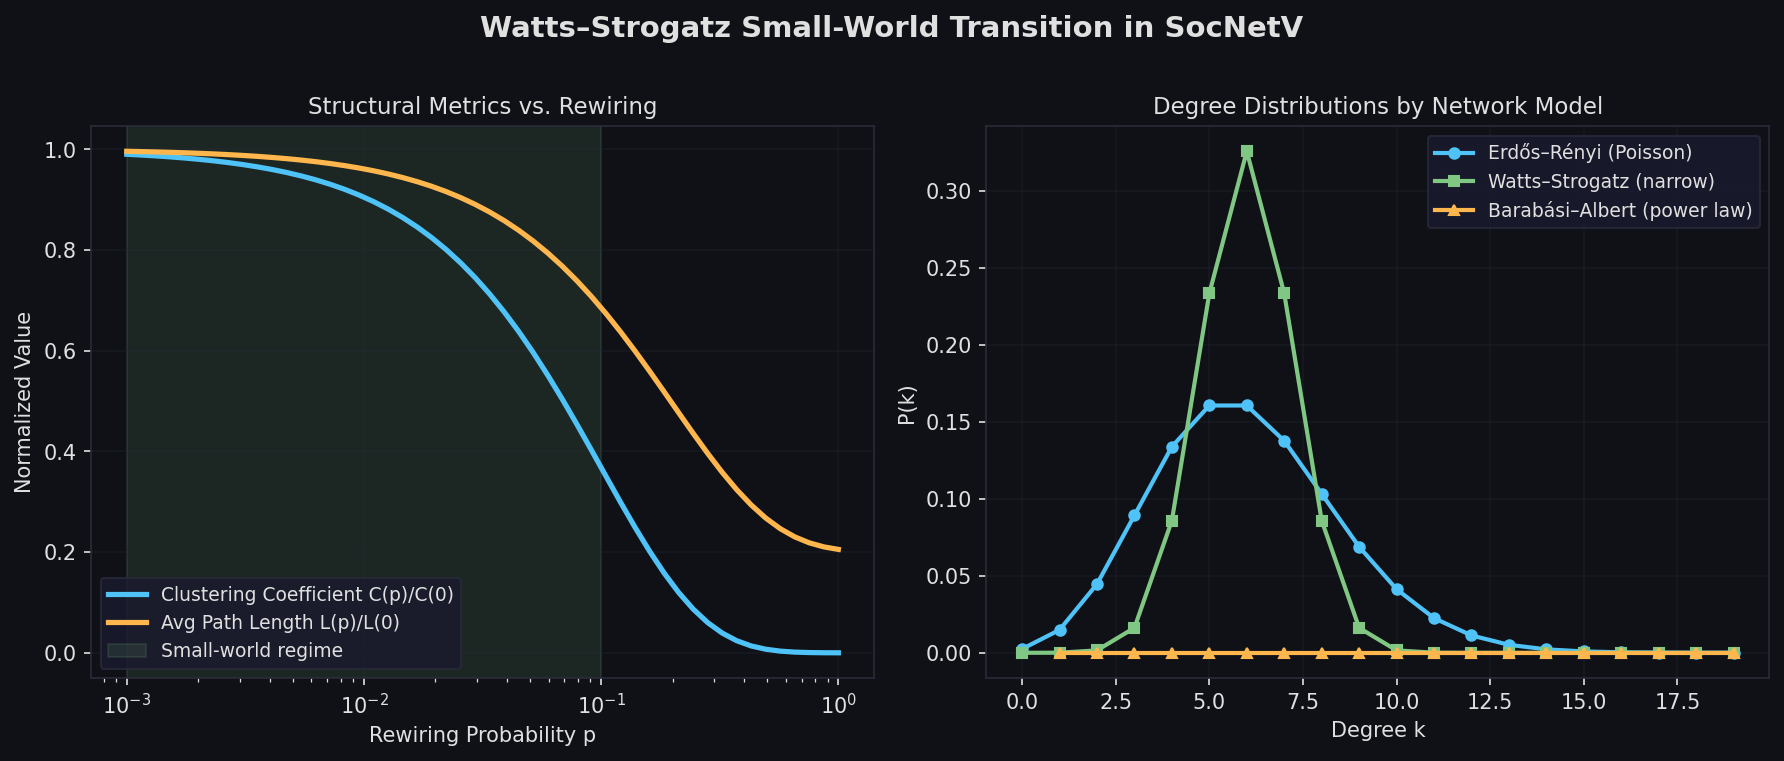
Practitioners can generate a Watts–Strogatz small-world network, compute its clustering coefficient and average path length, then incrementally increase the rewiring probability to observe the transition from regular to random topology — all within a single session. This makes SocNetV ideal for sensitivity analysis of how network structure affects diffusion outcomes before coupling the topology to a full agent-based model.
Diffusion and Spreading Simulations
SocNetV includes a built-in spreading simulation engine supporting:
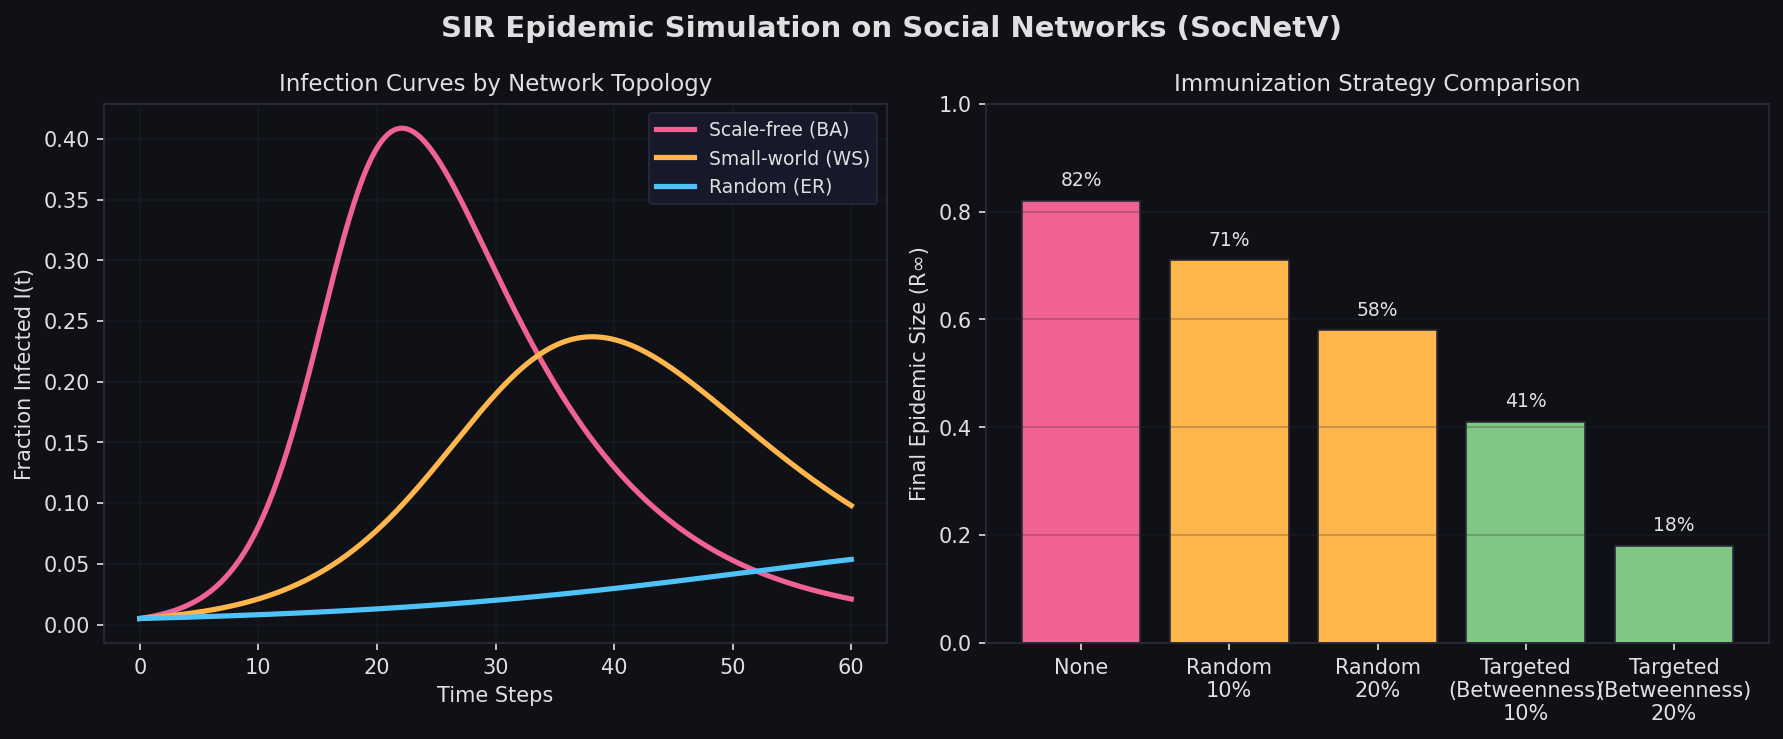
- SIR / SIS epidemic models: Configurable infection rate (β) and recovery rate (γ), with step-by-step visualization of node state transitions across the network.
- Threshold-based diffusion: Nodes adopt a behavior when a fraction of their neighbors have already adopted — directly modeling Granovetter-style threshold models of collective action.
The simulation runs interactively: users can pause at any time step, inspect individual node states, and adjust parameters mid-run. Output includes time-series plots of susceptible, infected, and recovered populations, exportable for downstream statistical analysis.
Practical Workflow: Calibrating a Diffusion Model
A typical research workflow using SocNetV proceeds as follows:
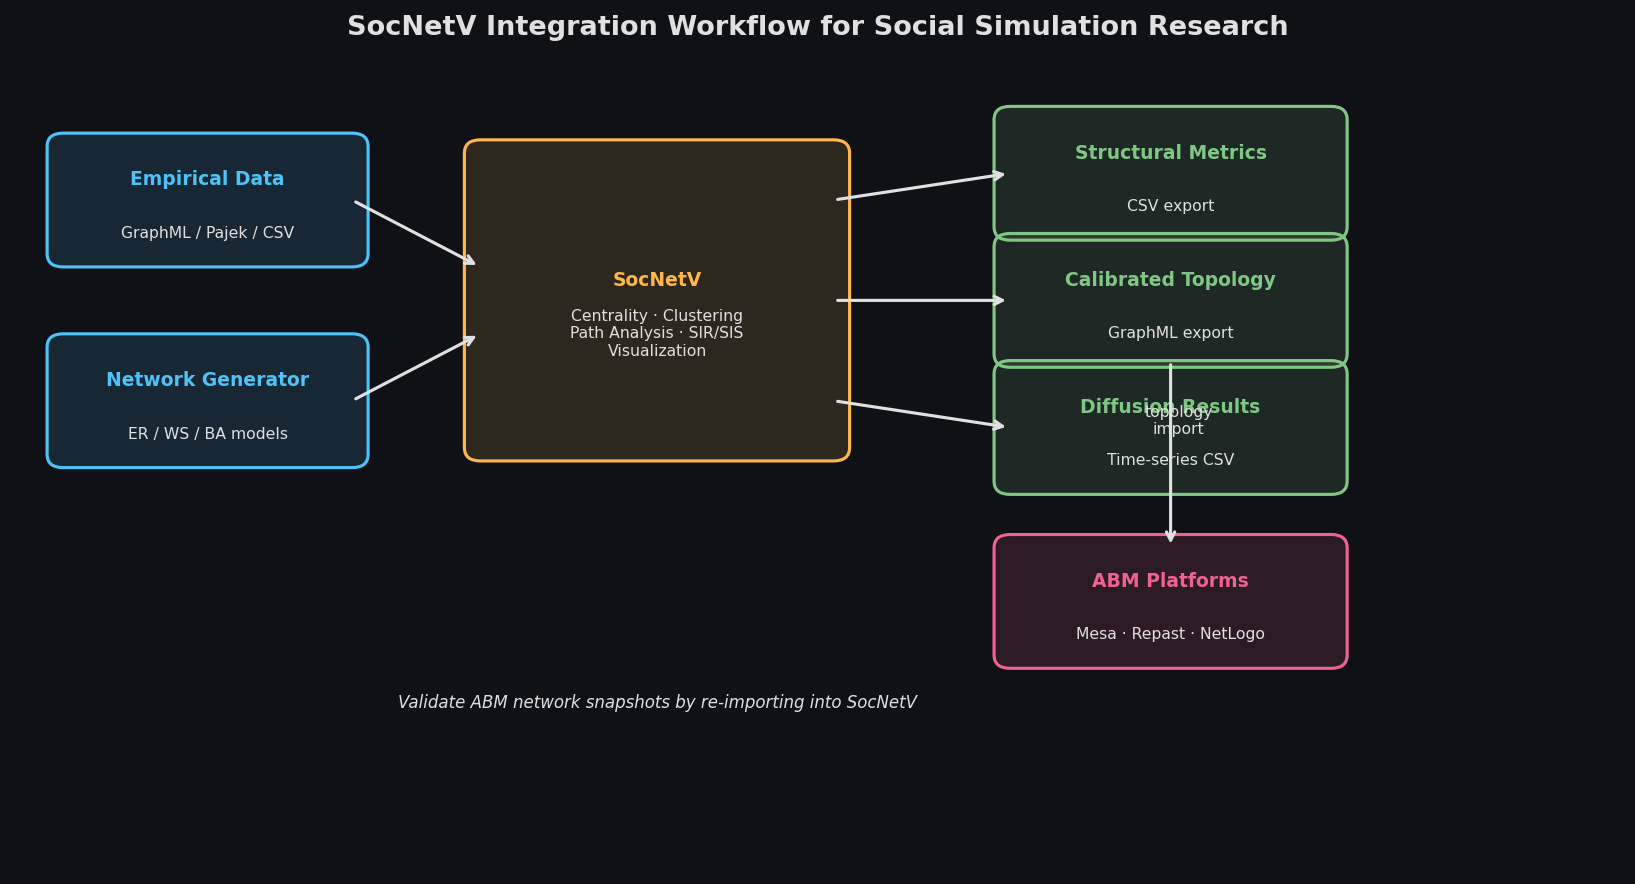
- Import empirical network data from GraphML, Pajek (.net), UCINET DL, or edge-list CSV formats.
- Compute baseline metrics — identify high-betweenness nodes that serve as structural bridges.
- Run SIR simulation with empirically estimated β and γ values; record peak infection time and final epidemic size.
- Perturb topology — remove top-betweenness nodes (simulating targeted immunization) and re-run to quantify structural resilience.
- Export results to CSV and visualize in R or Python for publication-quality figures.
This workflow is particularly valuable in organizational network analysis, where the "infection" represents the spread of a new practice, technology, or rumor through a firm's communication graph.
Integration with Broader Simulation Pipelines
SocNetV is not designed to replace full ABM platforms, but it excels as a preprocessing and validation layer:
- Generate a calibrated small-world or scale-free topology in SocNetV, export as GraphML, then import into Mesa, Repast Simphony, or NetLogo as the agent interaction network.
- Use SocNetV's centrality outputs to initialize agent heterogeneity — high-PageRank agents receive higher initial influence weights in the ABM.
- Validate ABM-generated network snapshots by importing them back into SocNetV and comparing structural metrics against the target distribution.
Limitations and Considerations
SocNetV is best suited for static or slowly evolving networks up to roughly 10,000–50,000 nodes. For temporally dynamic networks with millions of edges, dedicated libraries (graph-tool, SNAP) or distributed platforms (Repast4Py, FLAME GPU 2) are more appropriate. The built-in diffusion models are also relatively simple — practitioners needing multi-layer networks, heterogeneous agent cognition, or stochastic block models should treat SocNetV as a structural analysis companion rather than a primary simulation engine.
Getting Started
SocNetV is freely available at socnetv.org under the GPL license, with binaries for Windows, macOS, and Linux. The documentation includes worked tutorials on centrality analysis, random network generation, and SIR simulation. For scripted batch workflows, SocNetV exposes a command-line interface that accepts network files and metric flags, enabling integration into automated research pipelines.
For practitioners building social simulation models, SocNetV fills a genuine niche: a purpose-built, interactive environment for understanding the structural substrate before the agents start moving.
Further Reading
- SocNetV Official Documentation
- Wasserman, S. & Faust, K. (1994). Social Network Analysis: Methods and Applications. Cambridge University Press.
- Watts, D. J. & Strogatz, S. H. (1998). Collective dynamics of 'small-world' networks. Nature, 393, 440–442.
- Barabási, A.-L. & Albert, R. (1999). Emergence of scaling in random networks. Science, 286(5439), 509–512.
- Newman, M. E. J. (2010). Networks: An Introduction. Oxford University Press.