
EPA SWMM 5.2: Simulating Green Infrastructure Performance for Urban Stormwater Management
EPA SWMM 5.2: Urban Stormwater Runoff and Green Infrastructure Performance Simulation
Urban stormwater management has grown increasingly complex as cities face intensifying precipitation events driven by climate change. The U.S. Environmental Protection Agency's Storm Water Management Model (SWMM) — now at version 5.2 — remains the industry-standard open-source tool for simulating the full urban water cycle: rainfall-runoff generation, conveyance through pipe and channel networks, storage, treatment, and receiving-water impacts. This article focuses on SWMM 5.2's enhanced Low Impact Development (LID) / Green Infrastructure (GI) module, a capability that has matured significantly and is now central to modern urban drainage design.
Why SWMM for Green Infrastructure?
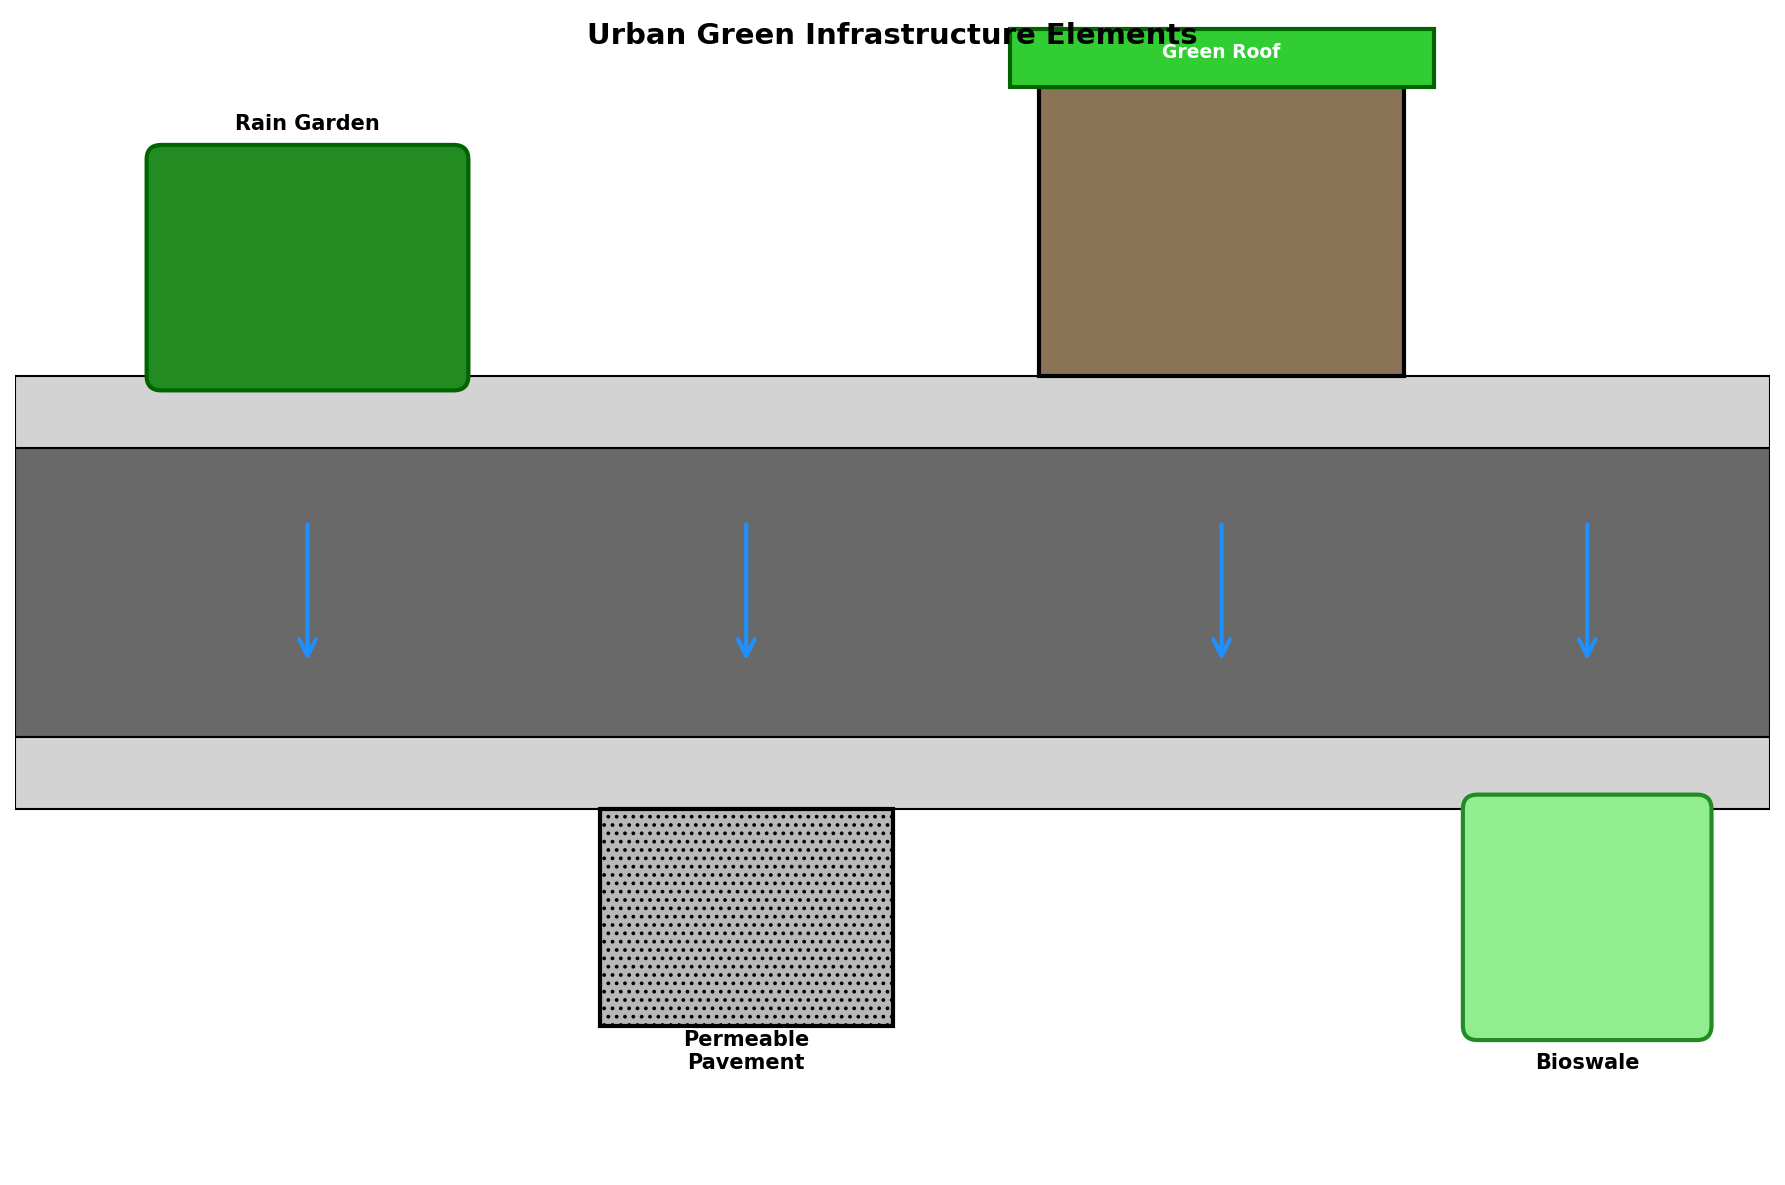
Traditional gray infrastructure (pipes, detention basins) is increasingly supplemented — or replaced — by nature-based solutions: bioretention cells, permeable pavements, green roofs, rain barrels, and vegetated swales. SWMM 5.2 models each of these as discrete LID controls with physically based vertical layer representations, allowing engineers to:
- Quantify peak-flow attenuation from individual parcels to catchment scale
- Evaluate combined gray-green system performance under design storms and continuous simulation
- Assess water quality co-benefits (TSS, nutrient load reduction) alongside volume control
- Optimize LID placement by comparing scenarios with different spatial configurations
LID Control Architecture in SWMM 5.2
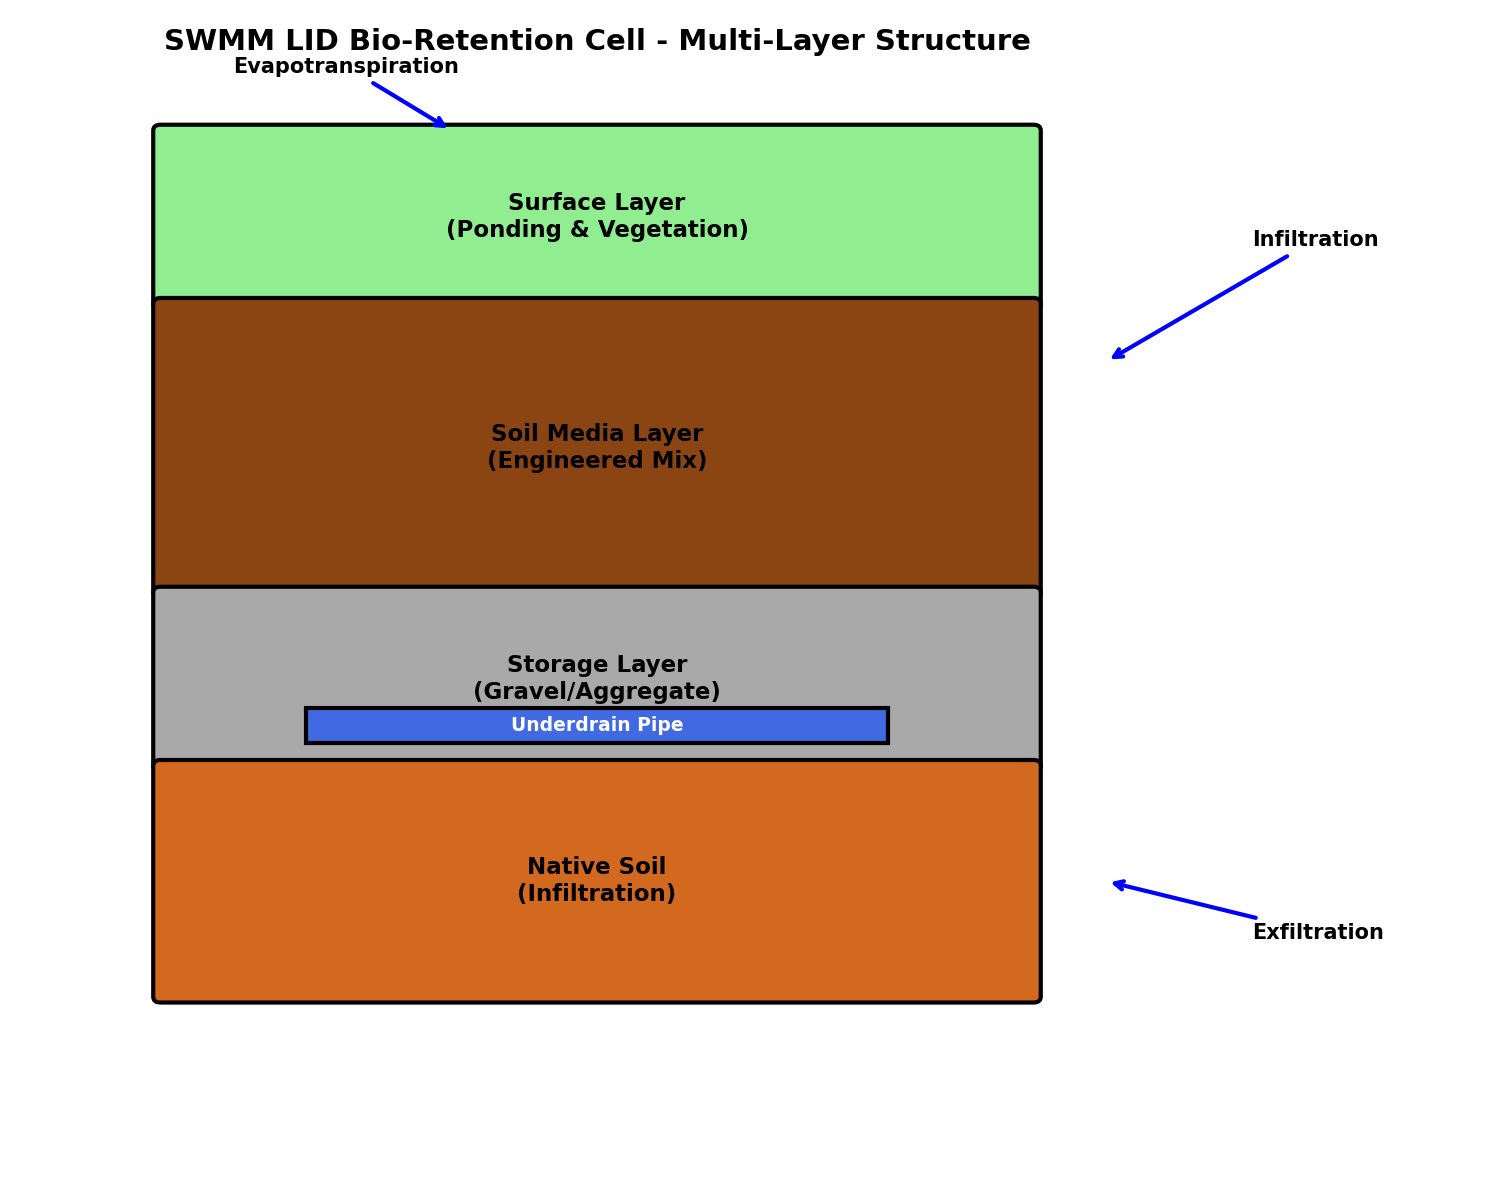
Each LID unit in SWMM is defined by a vertical stack of layers, each with its own hydraulic and hydrologic parameters:

| LID Type | Layers Modeled |
|---|---|
| Bio-retention cell | Surface ponding → Soil → Storage → Underdrain |
| Permeable pavement | Surface → Pavement → Soil → Storage → Underdrain |
| Green roof | Surface → Soil → Drainage mat |
| Rain barrel / cistern | Storage → Overflow |
| Vegetated swale | Surface (Manning's n, side slopes) |
| Infiltration trench | Surface → Storage → Underdrain |
Key parameters for the soil layer include saturated hydraulic conductivity (Ks), suction head (ψ), porosity, field capacity, and wilting point — all inputs to the Green-Ampt infiltration equation used internally. The storage layer is characterized by void ratio and seepage rate to native soil.
Version 5.2 Improvements
SWMM 5.2 (released 2022) introduced several refinements relevant to LID modeling:
- Revised Green-Ampt recovery: More accurate soil moisture redistribution between storm events, improving multi-event continuous simulations
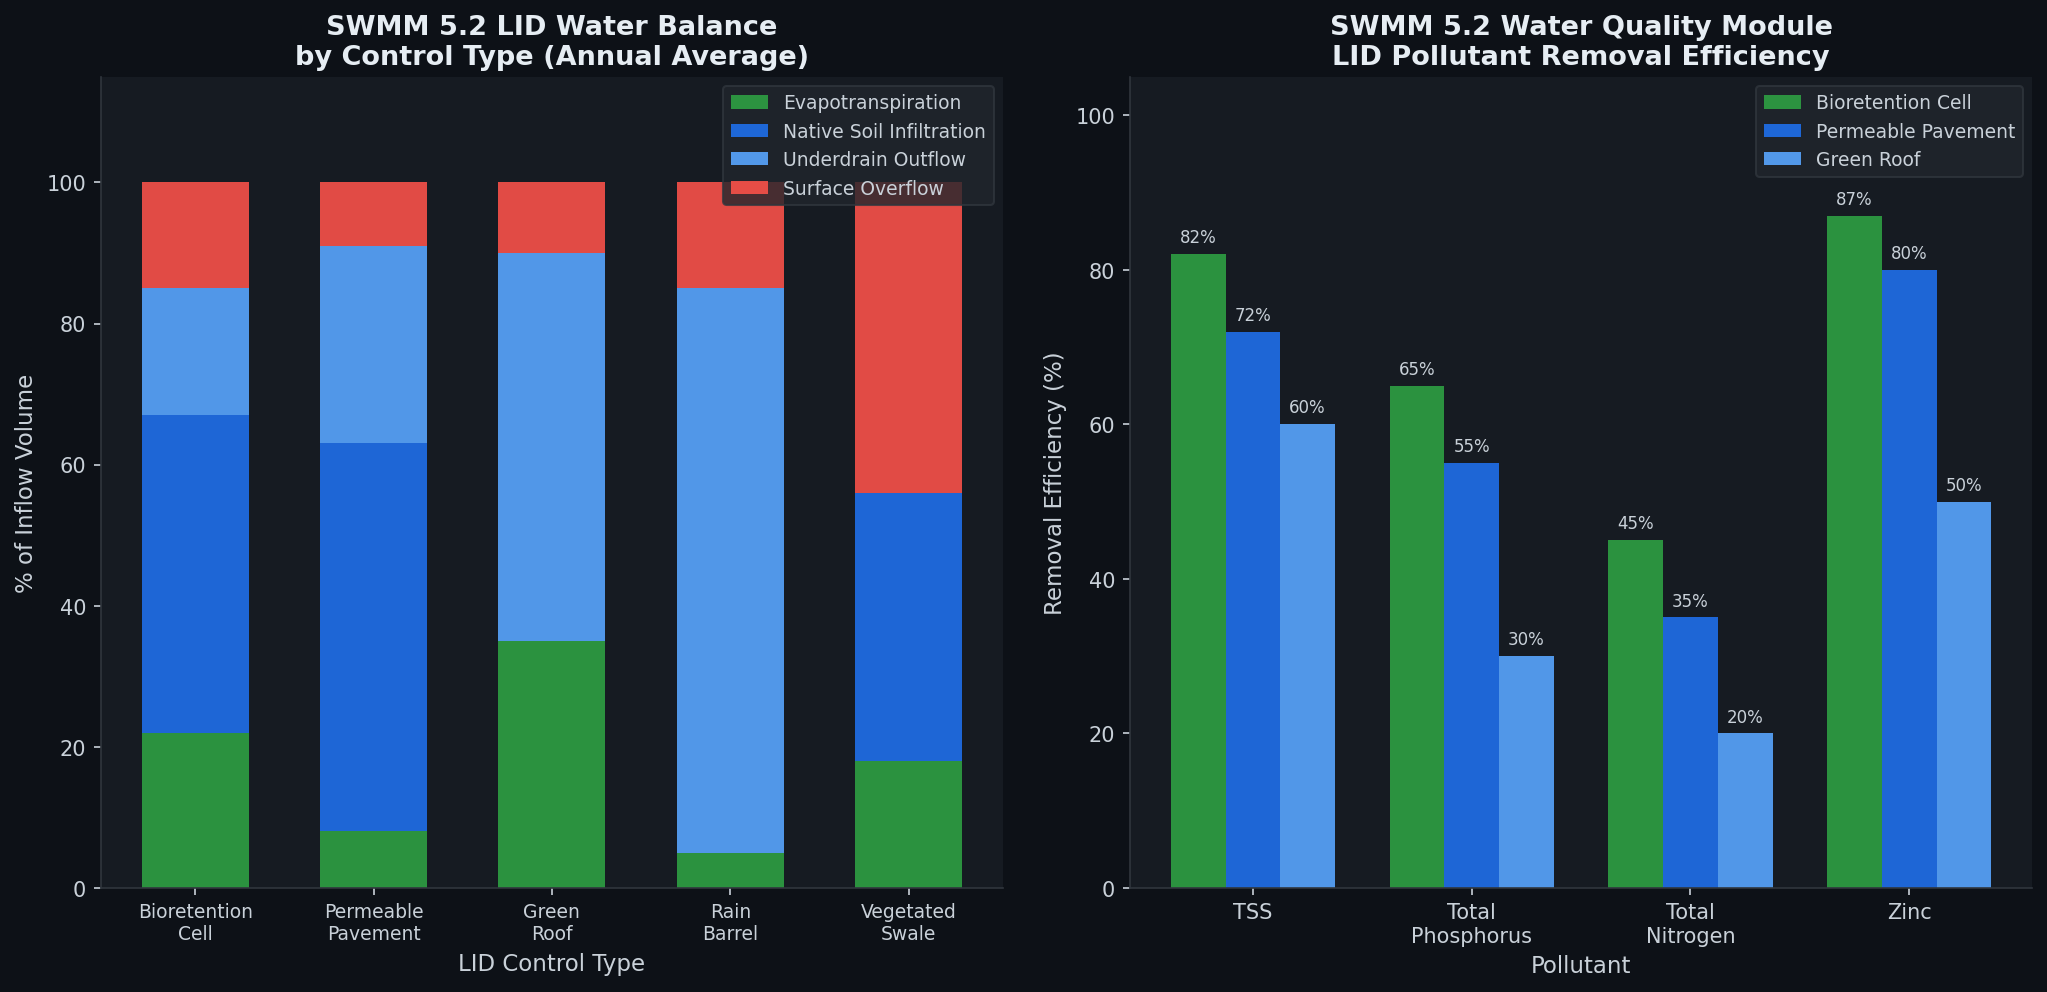
- LID water balance reporting: Dedicated output variables for each layer's inflow, outflow, evapotranspiration, and storage — critical for calibration
- Parallel processing support: Faster Monte Carlo and sensitivity analyses via OpenMP threading
- Enhanced RDII (Rainfall-Derived Inflow/Infiltration) unit hydrograph fitting for combined sewer systems
Setting Up a Green Infrastructure Scenario
1. Subcatchment Discretization
Effective LID modeling requires fine subcatchment delineation. Best practice is to separate impervious directly connected (DCIA) areas from pervious areas and LID-treated areas within each subcatchment. SWMM allows assigning a fraction of subcatchment area to one or more LID controls:
[LID_USAGE]
;;Subcatch  LIDProcess  Number  Area    Width   InitSat  FromImp  ToPerv  RptFile  DrainTo
S1          BioCell     3       150     5       0        25       0       *        *
The FromImp parameter (% of impervious area draining to the LID) is critical — it controls the effective contributing drainage area and directly affects peak-flow reduction estimates.
2. Calibration Strategy
For LID controls, calibration targets should include:
- Outflow volume (underdrain + overflow) from monitored bioretention cells
- Soil moisture time series if sensors are installed
- Ponding duration for surface layer validation
The most sensitive parameters are Ks (often 1–3 orders of magnitude uncertain in field soils) and the drainage coefficient of the underdrain orifice. A structured sensitivity analysis using SWMM's built-in Monte Carlo interface or external tools like PEST or SALib is strongly recommended before calibration.
3. Continuous vs. Design-Storm Simulation
Design-storm simulations (e.g., 2-yr, 10-yr, 100-yr SCS Type II) are standard for regulatory compliance but can overestimate LID performance because they assume dry antecedent conditions. Continuous simulation using multi-year hourly rainfall records (available from NOAA Atlas 14 or NCEI) captures:
- Antecedent soil moisture effects on infiltration capacity
- Seasonal ET variation (use Hargreaves or Penman-Monteith ET options in SWMM)
- Annual runoff volume reduction — the primary metric for many MS4 permits
For continuous runs exceeding 10 years, SWMM 5.2's parallel processing reduces runtimes from hours to minutes on modern multi-core workstations.
Water Quality Simulation with LID
SWMM's water quality module tracks user-defined pollutants (TSS, TN, TP, heavy metals) through buildup-washoff processes on subcatchment surfaces and first-order decay in storage layers. For LID controls, the soil layer acts as a filter medium with a user-specified first-order removal coefficient. Typical literature values:
| Pollutant | Bioretention Removal (%) | Permeable Pavement Removal (%) |
|---|---|---|
| TSS | 70–95 | 60–85 |
| Total Phosphorus | 50–80 | 40–70 |
| Total Nitrogen | 30–60 | 20–50 |
| Zinc | 80–95 | 70–90 |
These removal rates are highly site-specific; local monitoring data should always be used when available.
Integration with Other Tools
SWMM outputs (flow hydrographs, pollutographs) integrate readily with downstream tools:
- HEC-RAS: Export SWMM outfall hydrographs as boundary conditions for receiving-water flood routing
- SUSTAIN (EPA): Optimize LID placement and sizing using SWMM as the simulation engine
- PCSWMM (CHI): Commercial GUI with GIS integration, automated calibration, and batch scenario management
- Python/swmmio: Open-source Python library for scripted SWMM model manipulation, results parsing, and automated reporting
Practical Recommendations
- Use continuous simulation for volume-based permit compliance; reserve design storms for peak-flow infrastructure sizing.
- Validate soil hydraulic parameters with field infiltrometer tests — don't rely solely on textural class defaults.
- Model LID at the parcel scale first, then aggregate to catchment scale to avoid masking spatial heterogeneity.
- Report water balance closure for each LID unit as a QA check — SWMM 5.2's LID reporting makes this straightforward.
- Couple with climate projections: Drive SWMM with downscaled future precipitation (e.g., from CMIP6 via NASA NEX-GDDP) to assess LID performance under 2050–2080 design conditions.
Further Resources
- EPA SWMM Official Page — source code, user manual, and example datasets
- SWMM 5.2 Reference Manual — hydraulics, hydrology, and water quality equations
- swmmio Python Library — open-source scripting interface
- PCSWMM — commercial GUI with advanced calibration and GIS tools
- NOAA Atlas 14 — precipitation frequency data for continuous simulation inputs
- SUSTAIN User's Guide (EPA) — LID optimization framework built on SWMM
SWMM 5.2 is freely available from the U.S. EPA and runs on Windows, Linux, and macOS. Its combination of rigorous physics, open architecture, and active community support makes it the go-to platform for urban stormwater and green infrastructure simulation worldwide.