

AnyLogic System Dynamics: Modeling Market Adoption and Social Diffusion with the Bass Model
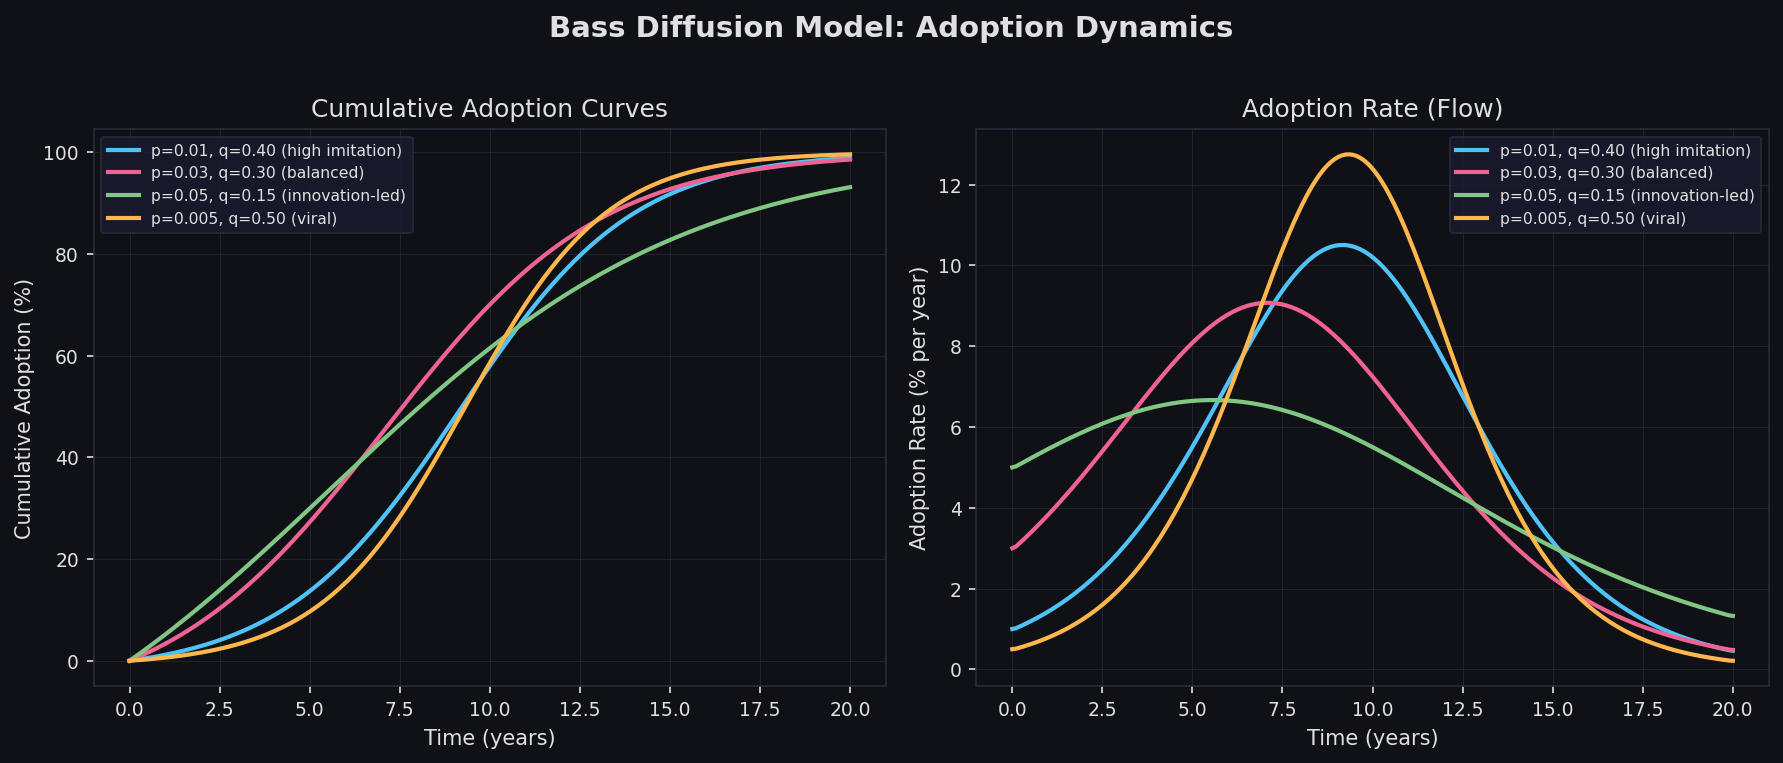
Market adoption and social diffusion processes—how innovations spread through populations, how word-of-mouth drives product uptake, how behavioral norms propagate across communities—are among the most consequential dynamics that organizations seek to understand and predict. AnyLogic's System Dynamics (SD) library provides a rigorous, visual environment for building and analyzing these feedback-driven models, with the Bass Diffusion Model as its canonical reference case. This article examines how practitioners can leverage AnyLogic SD to move beyond textbook Bass implementations toward calibrated, policy-relevant social diffusion simulators.
The Bass Model as a System Dynamics Archetype
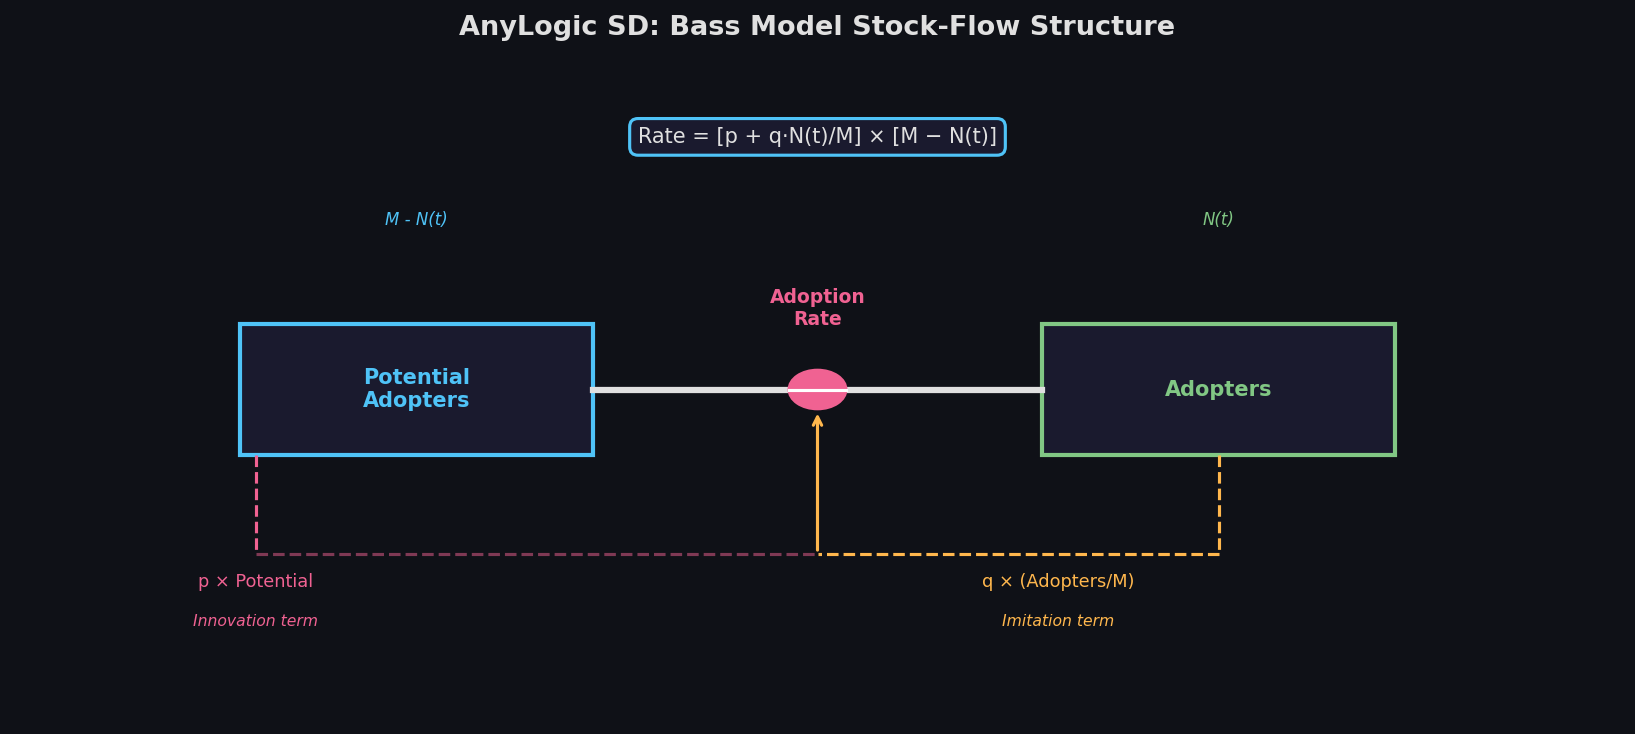
Frank Bass's 1969 model decomposes adoption into two channels: innovation (external influence, driven by advertising or inherent appeal) and imitation (internal influence, driven by word-of-mouth from existing adopters). In stock-and-flow notation:
- Potential Adopters (stock) — the population yet to adopt
- Adopters (stock) — the cumulative installed base
- Adoption Rate (flow) — governed by
p × Potential + q × (Adopters/Market_Size) × Potential
where p is the coefficient of innovation and q is the coefficient of imitation. AnyLogic's SD palette maps directly onto this structure: stocks become Stock elements, flows become Flow elements with rate expressions, and auxiliary variables capture intermediate calculations. The visual canvas makes the feedback loop—adopters driving imitation, which depletes potential adopters, which reduces future adoption—immediately legible to non-modelers.

Building a Calibrated Bass Model in AnyLogic
Parameterization from Historical Data
Raw Bass models are only as useful as their parameters. AnyLogic integrates with its built-in OptQuest optimizer and parameter variation experiments to fit p, q, and Market_Size against observed adoption time series. The workflow:
- Import historical sales or adoption data as a
DataSetobject. - Define an objective function (e.g., sum of squared errors between simulated and observed cumulative adoption).
- Run an Optimization Experiment with bounds on
p(typically 0.001–0.05) andq(typically 0.1–0.5) to minimize the objective.
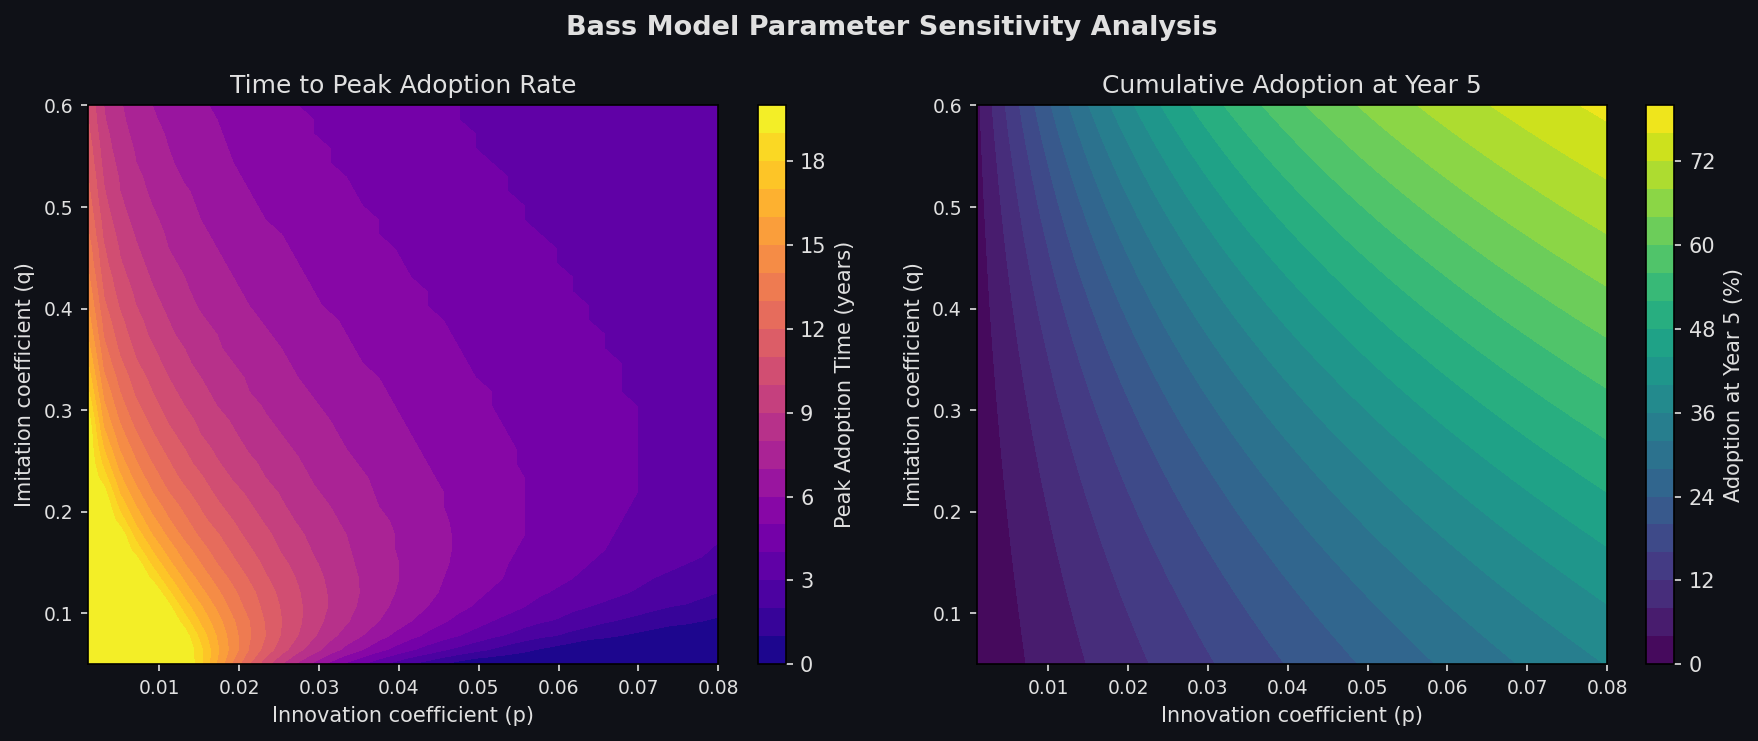
AnyLogic's parameter variation experiment can also generate sensitivity surfaces—plotting peak adoption timing and magnitude across the (p, q) space—revealing how robust forecasts are to parameter uncertainty.
Extending to Segmented Markets
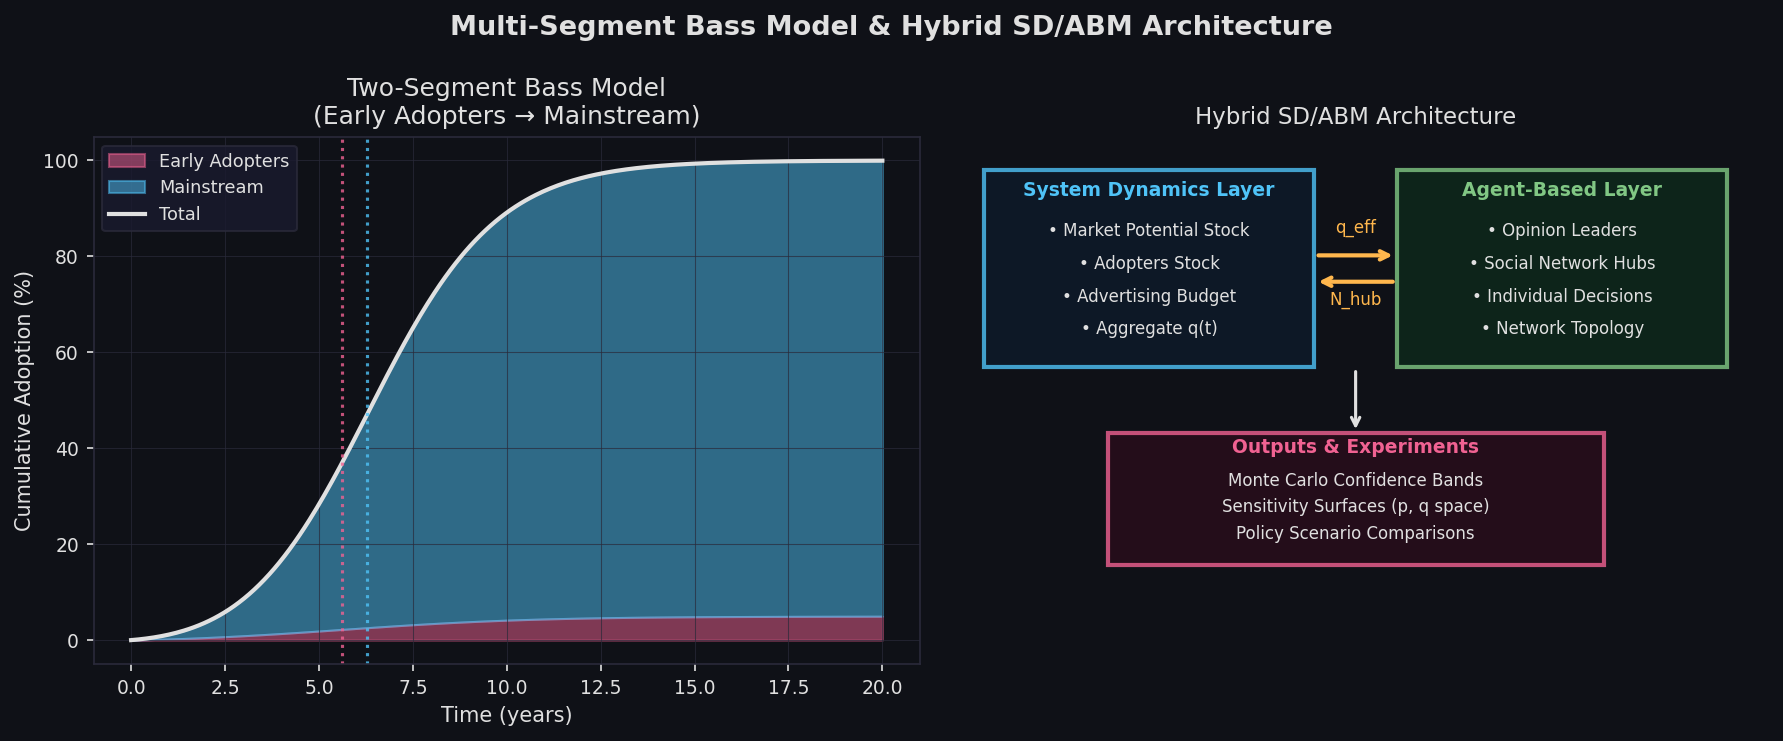
Real markets are rarely homogeneous. AnyLogic SD supports multi-segment Bass models by replicating the stock-flow structure across demographic or geographic segments and coupling them through cross-segment imitation terms. For example, a two-segment model (early adopters vs. mainstream) adds:
- Separate
Potential_EarlyandPotential_Mainstocks - A cross-imitation flow where mainstream adoption is influenced by early-adopter density
- A segment-switching flow if early adopters can "graduate" to mainstream status
This structure captures the chasm dynamics described by Geoffrey Moore: the innovation coefficient dominates early-segment uptake, while imitation from early adopters eventually triggers mainstream crossing.
Incorporating Marketing Mix Variables
Static p and q parameters assume constant marketing effort. AnyLogic SD allows these to become time-varying auxiliaries driven by:
- Advertising spend schedules —
p(t) = p_base × (1 + α × AdSpend(t))whereAdSpendis a lookup table or policy function - Price elasticity — coupling a pricing sub-model where lower prices increase effective market size
- Seasonal effects — multiplying adoption rates by a periodic function calibrated to historical seasonality
The result is a closed-loop marketing simulator: managers can test "what if we double Q3 advertising spend?" and observe the downstream effect on adoption trajectory and peak timing.
Hybrid SD/ABM for Heterogeneous Diffusion
AnyLogic's unique multi-method capability allows SD stocks to coexist with Agent-Based populations in the same model. A practical hybrid architecture for social diffusion:
- SD layer: tracks aggregate market dynamics (total potential, total adopters, advertising budget)
- ABM layer: represents a sample of influential agents (opinion leaders, social hubs) whose individual adoption decisions feed back into the SD imitation coefficient
This approach captures network topology effects—hub-and-spoke vs. lattice vs. random networks—that pure SD cannot represent, while retaining SD's computational efficiency for the bulk population. The Main agent's SD stocks can read from the ABM population's adoption state via AnyLogic's cross-method variable bindings.
Validation and Sensitivity Analysis
AnyLogic provides three experiment types critical for SD model validation:
Monte Carlo Experiment: Samples p, q, and Market_Size from probability distributions (e.g., triangular distributions reflecting expert uncertainty) and generates adoption trajectory confidence bands. This is essential for communicating forecast uncertainty to decision-makers.
Sensitivity Analysis Experiment: Computes partial derivatives of output metrics (peak adoption time, total adoption at year 5) with respect to each parameter, identifying which uncertainties most affect conclusions.
Calibration Experiment: Uses historical data to iteratively update parameter distributions using a Bayesian-style updating loop, narrowing uncertainty as more data arrives.
Practical Considerations for Social Diffusion Modeling
Market size estimation is often the dominant source of error. AnyLogic SD practitioners should treat Market_Size as a dynamic variable—potentially growing as prices fall or awareness increases—rather than a fixed constant.
Negative word-of-mouth can be incorporated by adding a "disadoption" flow driven by adopter dissatisfaction, modeled as a function of product quality metrics or support capacity constraints.
Regulatory and competitive shocks are best represented as discrete events in AnyLogic's event calendar, which can instantaneously shift parameter values or inject step changes into stock levels—simulating a competitor product launch or a regulatory approval.
Further Resources
- AnyLogic System Dynamics Reference
- Bass, F.M. (1969). "A New Product Growth for Model Consumer Durables." Management Science, 15(5), 215–227.
- AnyLogic Model Library: Bass Diffusion Example
- [Sterman, J.D. (2000). Business Dynamics: Systems Thinking and Modeling for a Complex World. McGraw-Hill.]
AnyLogic's System Dynamics library transforms the Bass model from a static forecasting equation into a living, policy-testable simulator. By combining calibration experiments, multi-segment extensions, and hybrid SD/ABM coupling, practitioners can build social diffusion models that are both theoretically grounded and operationally actionable.