
Bottleneck Analysis in Siemens Plant Simulation: Identifying Production Constraints with Sankey Diagrams
Manufacturing efficiency hinges on identifying and eliminating bottlenecks—those critical constraints that limit overall system throughput. Siemens Plant Simulation (formerly Tecnomatix Plant Simulation) offers sophisticated bottleneck analysis capabilities that go beyond simple utilization metrics, providing engineers with powerful visualization tools to pinpoint production constraints and optimize material flow.
Understanding Bottleneck Detection Methodology
Plant Simulation employs a multi-dimensional approach to bottleneck identification that considers not just machine utilization, but also blocking and starvation states. A true bottleneck exhibits high utilization while simultaneously causing downstream starvation or upstream blocking. The software's bottleneck analyzer automatically tracks these interdependencies across the entire production system, calculating a bottleneck index that weights both direct utilization and indirect impact on system performance.
The bottleneck detection algorithm runs continuously during simulation execution, sampling station states at configurable intervals. This dynamic analysis captures transient bottlenecks that may shift throughout a production shift due to product mix changes, setup times, or random failures—phenomena that static capacity calculations often miss.

Sankey Diagram Visualization for Material Flow Analysis
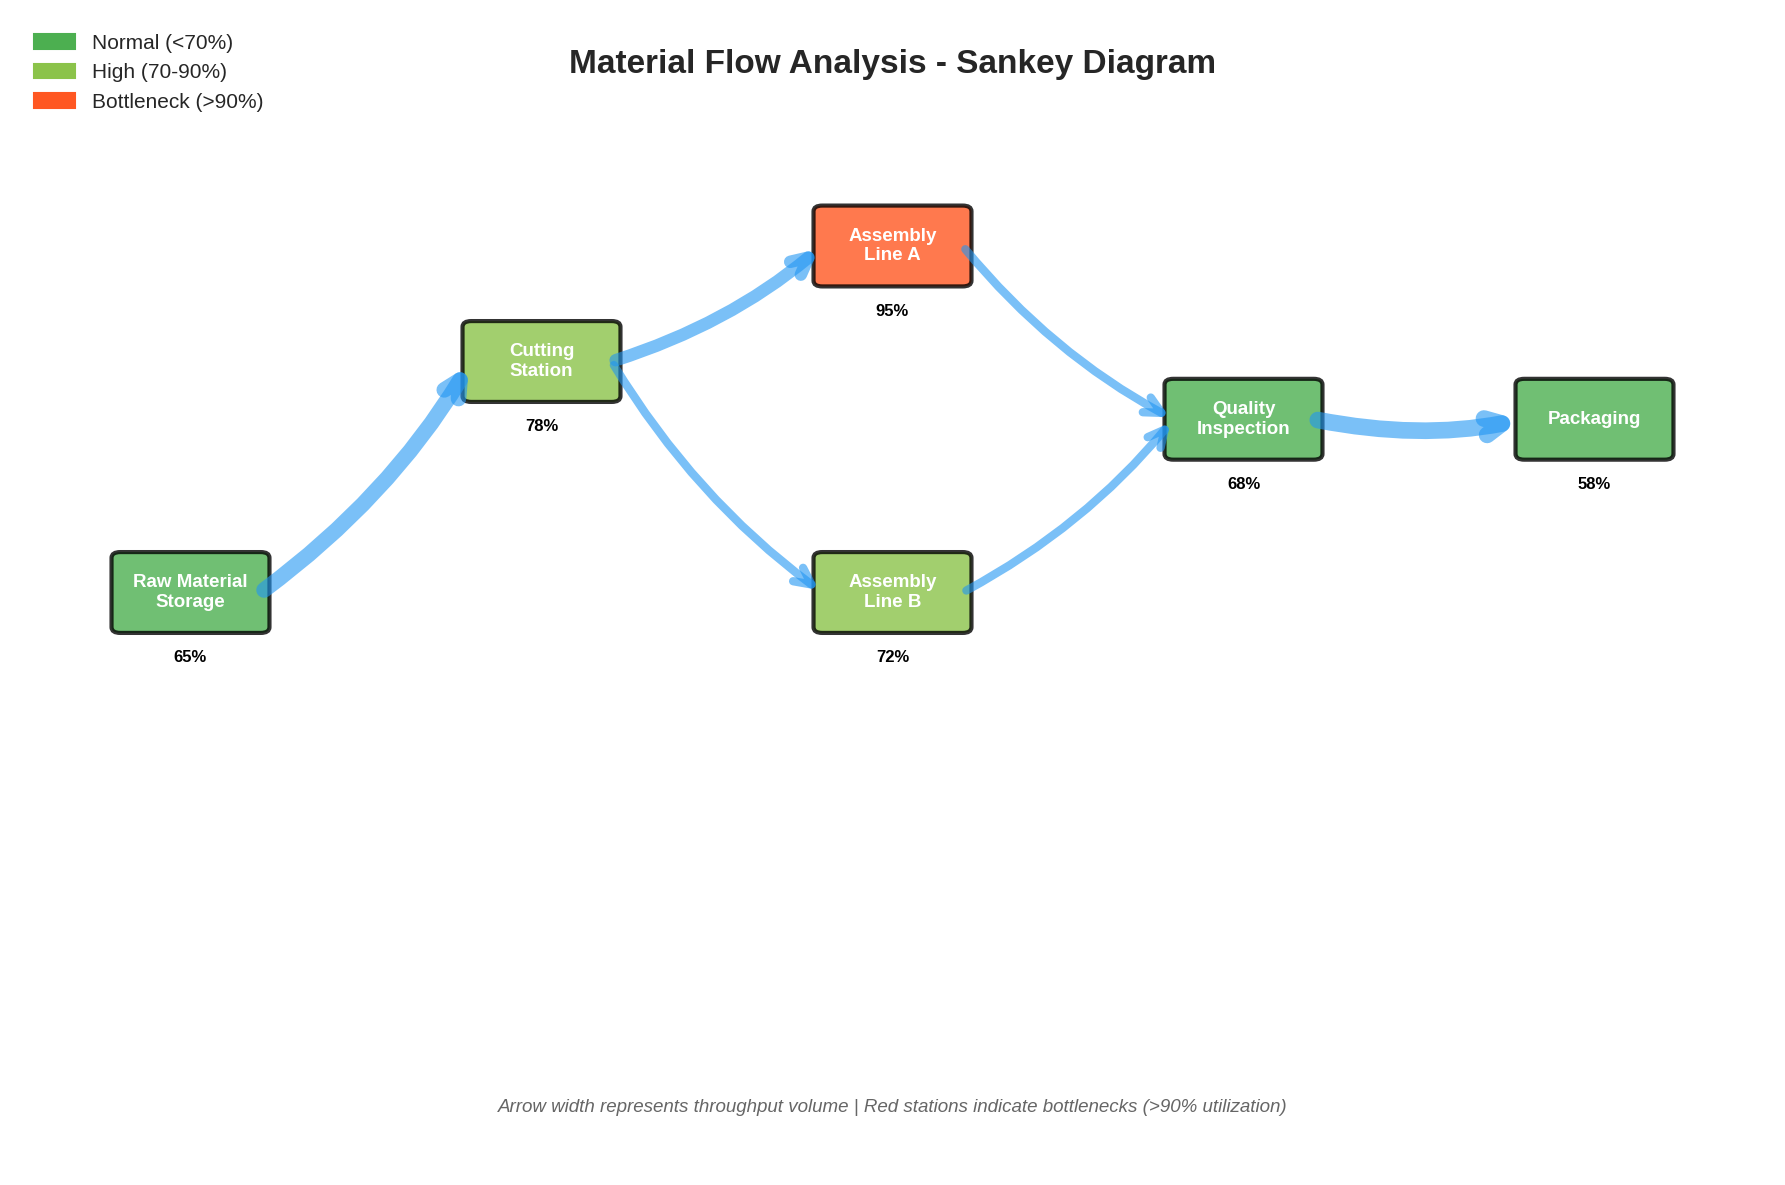
One of Plant Simulation's most powerful features is its integrated Sankey diagram generator, which visualizes material flow quantities between production stations. These flow diagrams use proportional arrow widths to represent throughput volumes, making bottlenecks immediately apparent through visual constriction points in the flow network.
The Sankey visualization can be configured to display multiple metrics simultaneously: part counts, cycle times, work-in-process levels, or value-added content. Color coding highlights stations operating above threshold utilization levels, while animation capabilities allow engineers to observe how bottlenecks migrate over time. This visual approach proves particularly valuable when presenting findings to non-technical stakeholders who may struggle with tabular utilization reports.
Implementing Bottleneck Analysis in Practice
To leverage Plant Simulation's bottleneck analysis effectively, engineers should configure the Bottleneck Analyzer object within their model hierarchy. This object requires specification of the observation period, sampling frequency, and threshold criteria for bottleneck classification. Best practice suggests running multiple replications with different random seeds to distinguish systematic bottlenecks from statistical artifacts.
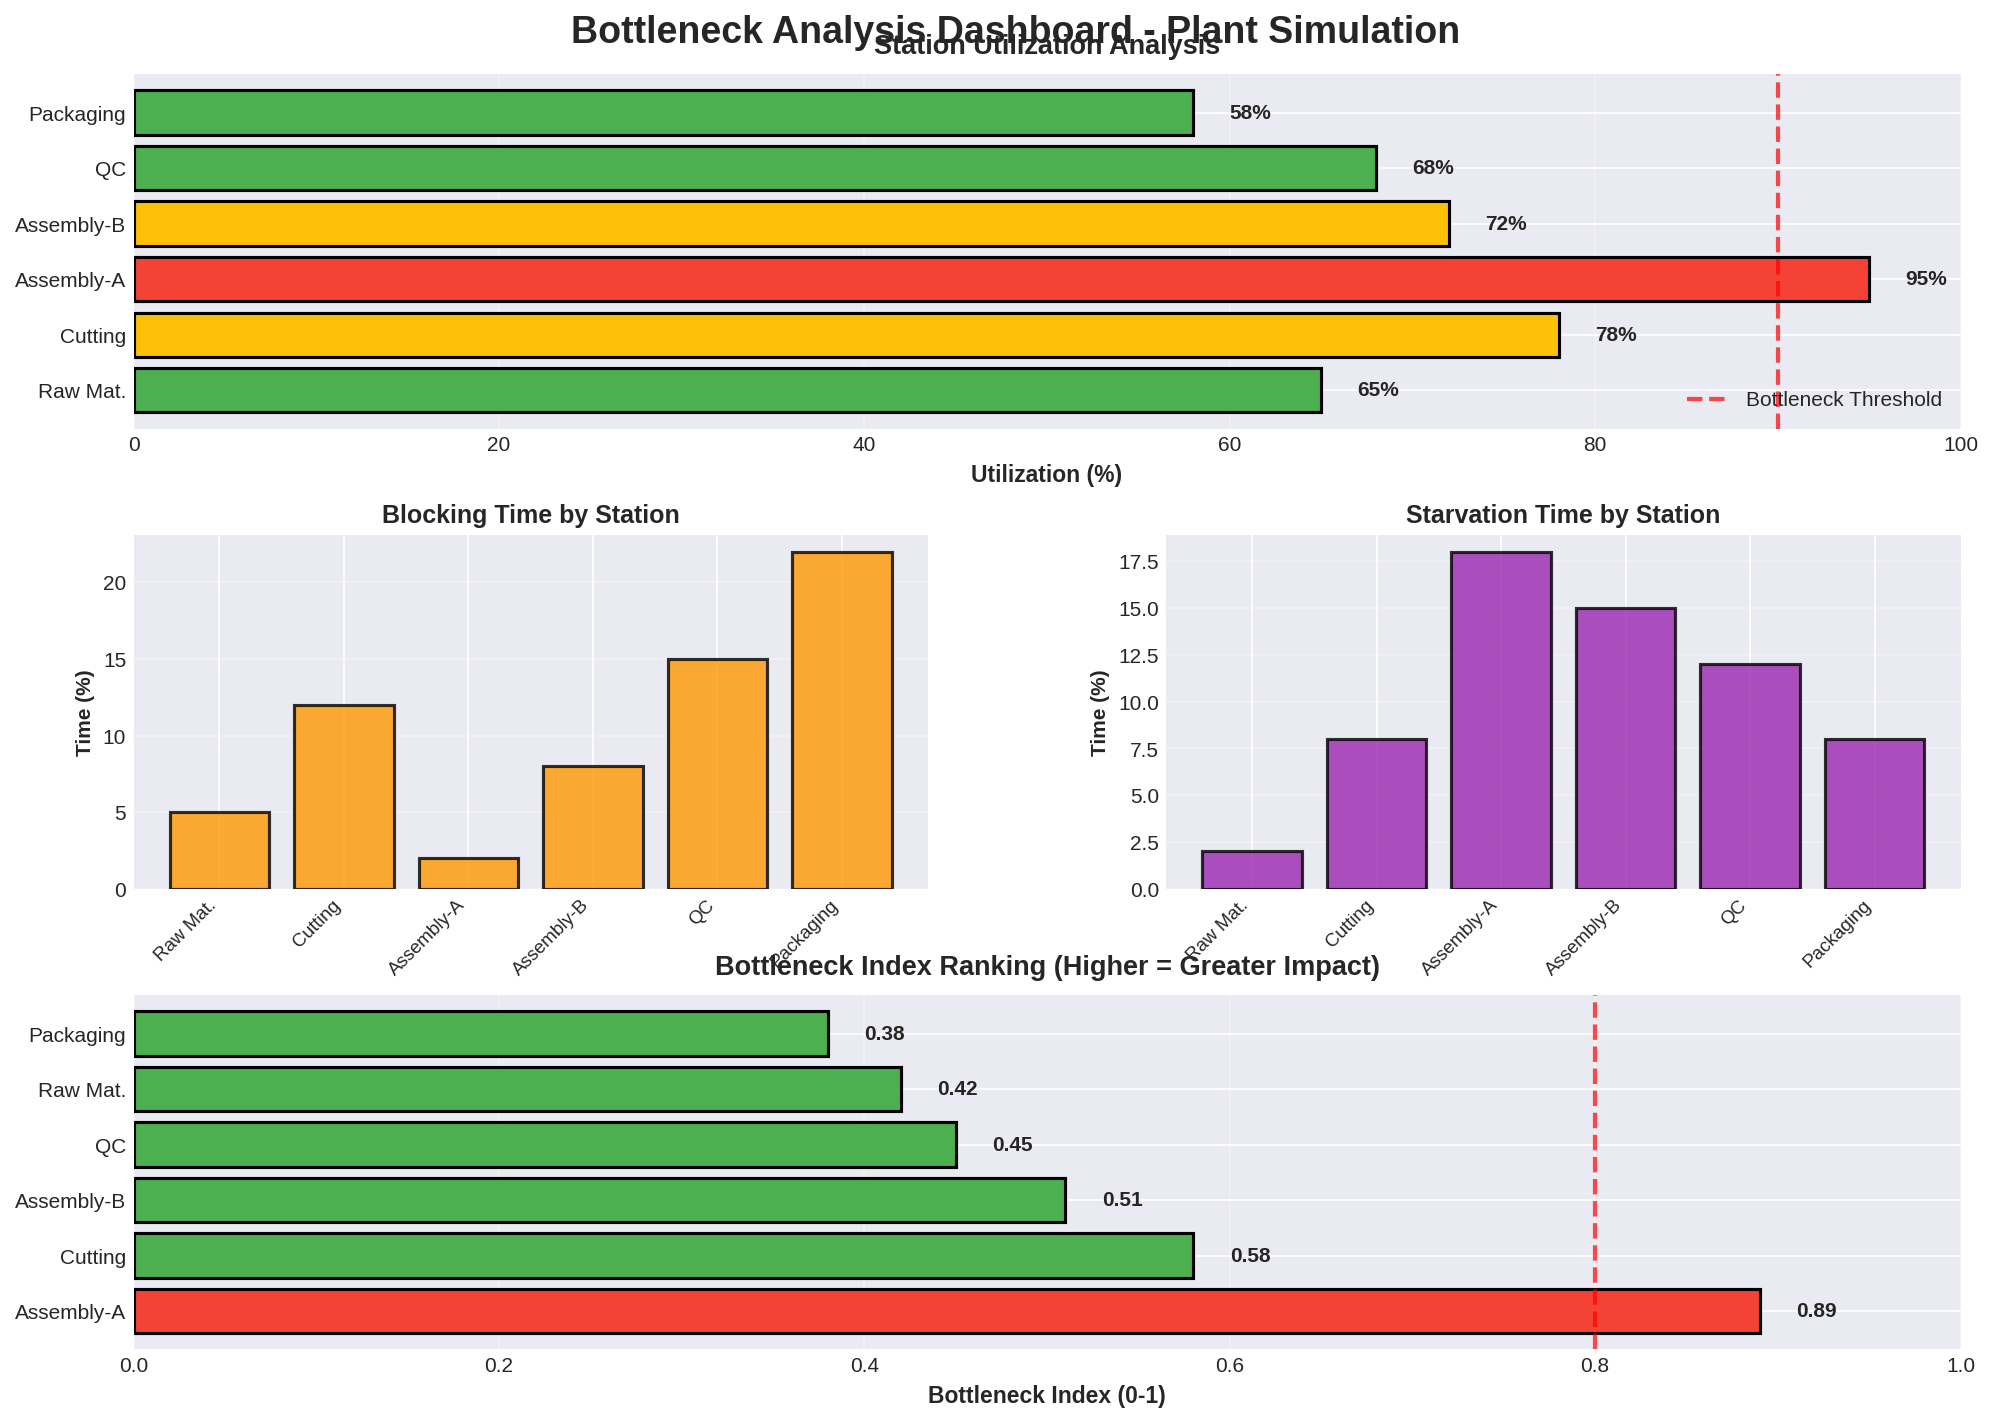
The software generates comprehensive bottleneck reports that rank stations by their impact on system throughput. These reports include not only utilization percentages but also blocking time, starvation time, and the calculated bottleneck index. Cross-referencing these metrics with the Sankey diagram reveals whether a bottleneck stems from insufficient capacity, poor buffer placement, or upstream variability propagation.
Advanced Applications and Integration
Plant Simulation's bottleneck analysis integrates seamlessly with its optimization modules, enabling automated what-if scenarios. Engineers can programmatically adjust buffer sizes, add parallel resources, or modify routing logic while monitoring the impact on bottleneck severity. The software's genetic algorithm optimizer can even automatically search for configurations that minimize the primary bottleneck's impact.
For facilities implementing Industry 4.0 initiatives, Plant Simulation supports real-time data integration through OPC UA and SQL database connections. This capability enables digital twin applications where live production data continuously updates the simulation model, allowing bottleneck analysis to reflect current shop floor conditions rather than theoretical design parameters.
Practical Considerations and Limitations
While Plant Simulation's bottleneck analysis is powerful, users should recognize its assumptions. The standard bottleneck analyzer assumes deterministic processing times unless explicitly modeled with statistical distributions. In high-mix, low-volume environments, the bottleneck may shift so frequently that traditional analysis becomes less actionable—in such cases, focusing on system flexibility and quick changeover capabilities may prove more valuable than eliminating any single constraint.
Additionally, the Sankey diagram's effectiveness diminishes in highly complex networks with hundreds of stations and routing paths. For large-scale models, hierarchical decomposition—analyzing subsystems independently before integrating results—often yields clearer insights than attempting to visualize the entire facility simultaneously.
Conclusion
Siemens Plant Simulation's bottleneck analysis tools, particularly when combined with Sankey diagram visualization, provide manufacturing engineers with actionable insights for capacity planning and continuous improvement initiatives. By moving beyond simple utilization metrics to consider blocking, starvation, and dynamic system behavior, these tools enable data-driven decisions that maximize return on capital investments in production equipment.
For organizations serious about operational excellence, mastering these analytical capabilities represents a significant competitive advantage in an era where manufacturing agility and efficiency increasingly determine market success.