
FlexSim's Input Analyzer: Fitting Statistical Distributions to Real-World Manufacturing Data
Accurate simulation results depend on accurate inputs. No matter how carefully a manufacturing engineer constructs a FlexSim model—defining workstations, conveyors, and routing logic—the model's predictive power is only as good as the statistical distributions driving process times, inter-arrival intervals, and failure durations. FlexSim's built-in Input Analyzer addresses this challenge directly, providing a rigorous workflow for fitting theoretical distributions to empirical shop-floor data before a single simulation run begins.
Why Input Analysis Matters
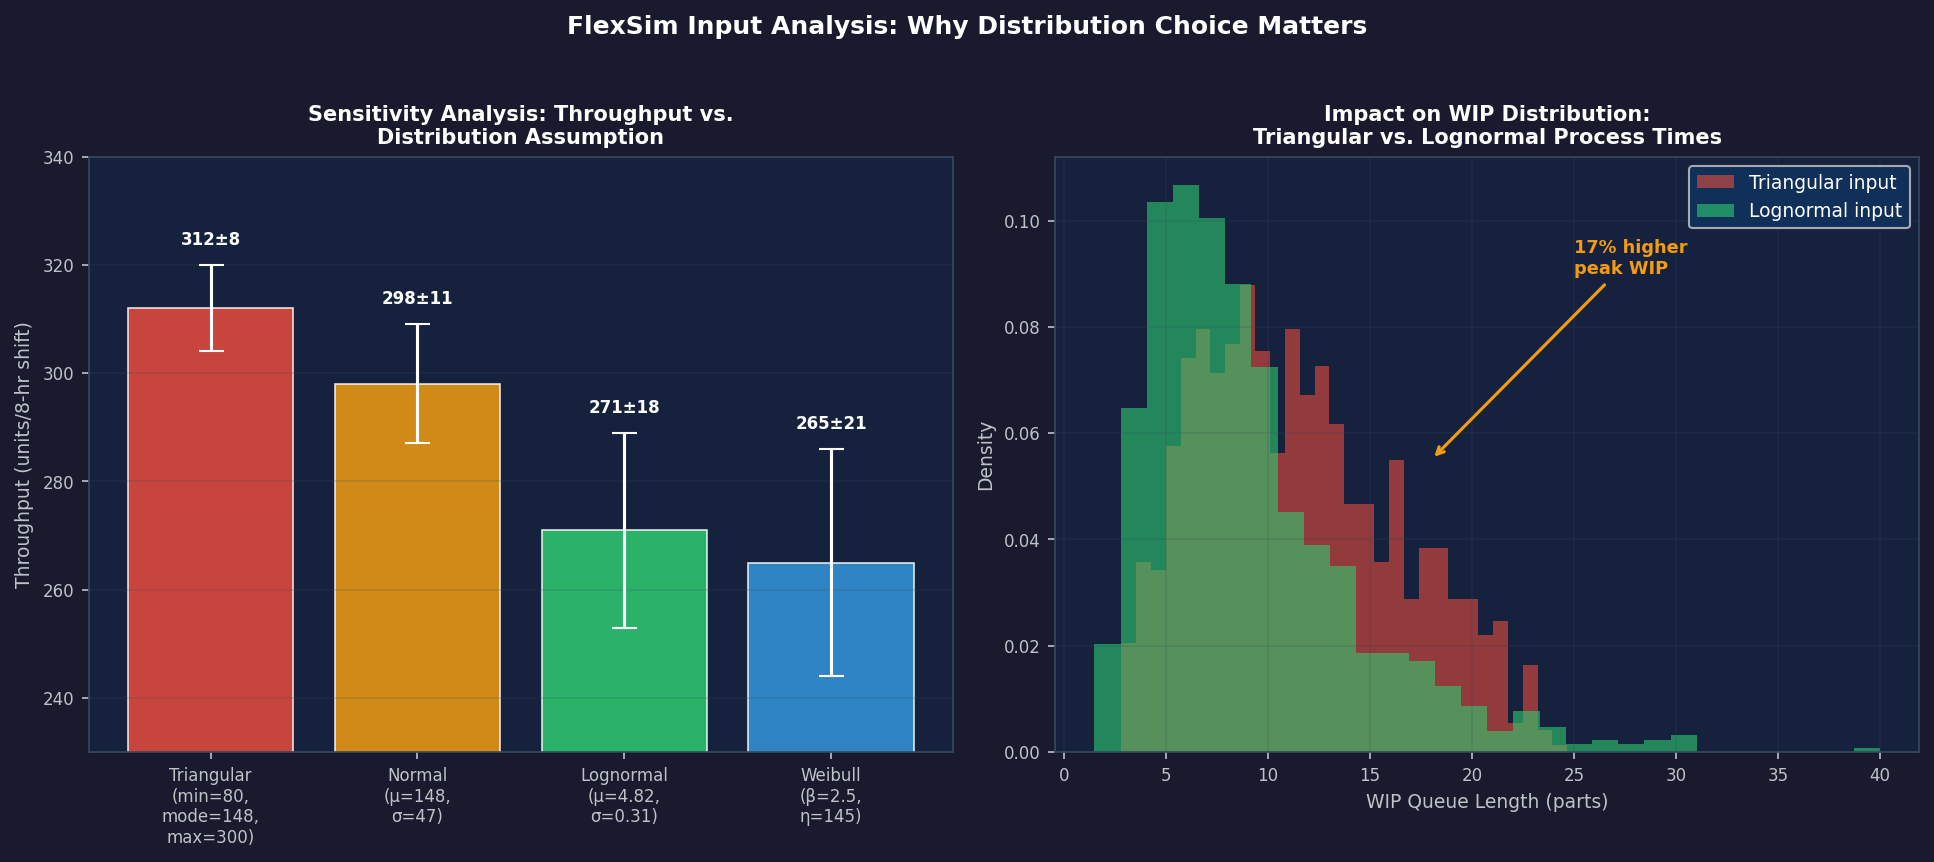
A common modeling shortcut is to use a triangular or uniform distribution when only a minimum, most-likely, and maximum value are known. While expedient, this approach can significantly misrepresent the tail behavior of real processes. A machining cycle that occasionally runs 3× its nominal time due to tool wear or operator intervention will produce very different throughput and WIP profiles than a symmetric triangular distribution suggests. The Input Analyzer replaces guesswork with statistically defensible parameter estimates, directly improving model credibility and the quality of capacity-planning decisions.
Collecting and Importing Data
The Input Analyzer accepts data in two forms: a comma-separated list typed directly into the tool, or a CSV file exported from a manufacturing execution system (MES), OEE platform, or time-study spreadsheet. For best results, collect at least 30–50 observations per process step; cycle-time data from automated sensors often yields hundreds of records, enabling tighter confidence intervals on fitted parameters.

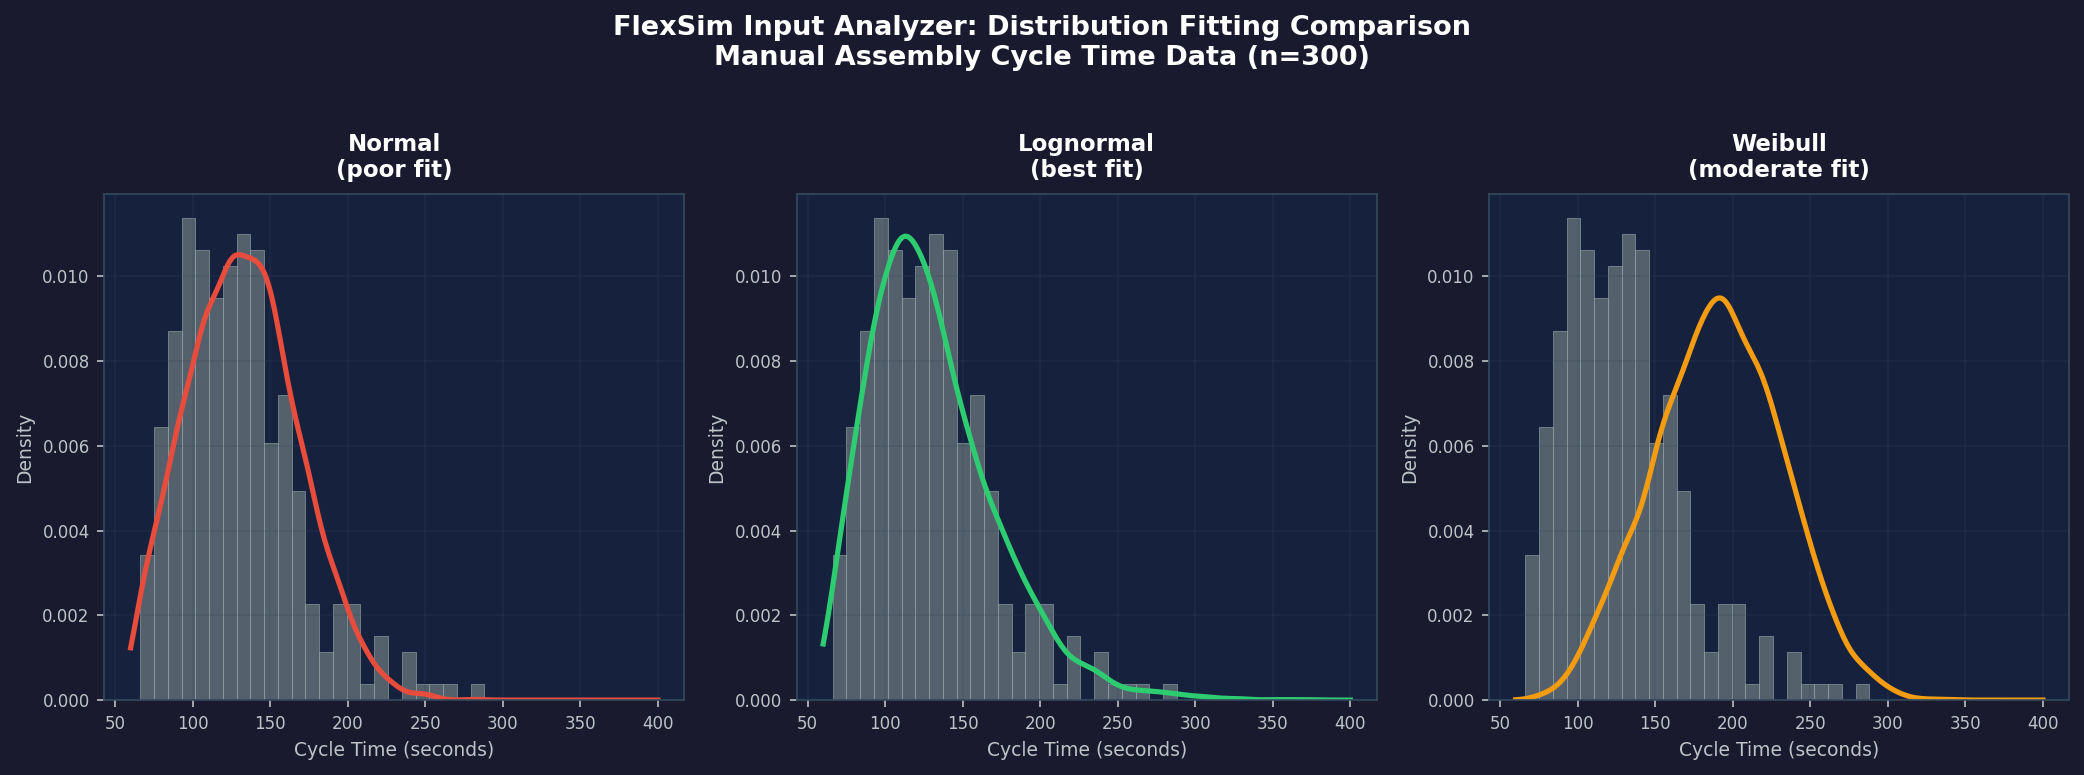
Once data is loaded, FlexSim displays a histogram alongside summary statistics—mean, standard deviation, minimum, maximum, and sample size. Engineers should inspect the histogram before fitting: a strongly bimodal distribution (e.g., a workstation that runs two distinct product families) may need to be split into separate distributions conditioned on product type rather than forced into a single unimodal fit.
Automated Distribution Fitting
Clicking Fit triggers FlexSim's automated fitting engine, which evaluates a library of candidate distributions including:
- Exponential — appropriate for memoryless inter-arrival times in Poisson processes
- Normal — symmetric processes with well-defined means (e.g., automated assembly steps)
- Lognormal — right-skewed processes common in manual assembly and repair tasks
- Weibull — flexible two-parameter family useful for failure-time modeling
- Gamma — generalizes the exponential; useful for multi-stage service processes
- Triangular / Uniform — fallback when sample sizes are too small for parametric fitting
- Empirical (histogram) — preserves the exact observed distribution when no parametric family fits well
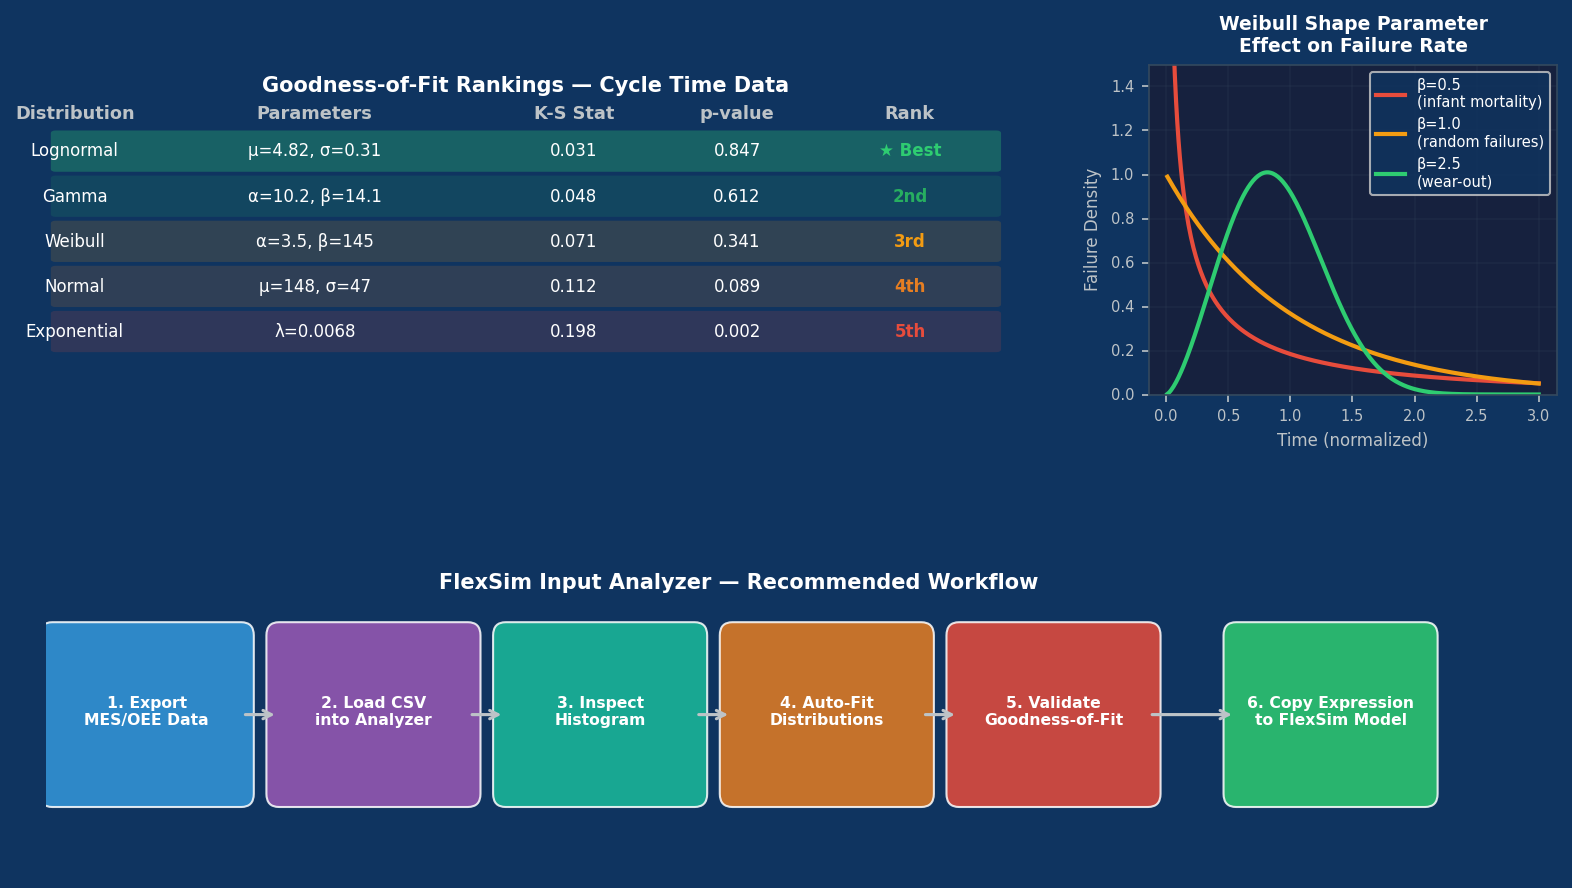
For each candidate, FlexSim computes the Chi-squared goodness-of-fit statistic and the Kolmogorov-Smirnov (K-S) statistic, ranking distributions by their p-values. The tool highlights the best-fit distribution in green and displays the fitted parameters alongside the theoretical PDF overlaid on the observed histogram.
Interpreting Goodness-of-Fit Results
A high p-value (conventionally > 0.05) indicates that the observed data are consistent with the fitted distribution—the null hypothesis that the data follow that distribution cannot be rejected. Engineers should, however, treat statistical tests as one input among several:
- Visual inspection: Does the fitted PDF curve follow the histogram's shape, especially in the tails?
- Domain knowledge: Does the chosen distribution make physical sense? Exponential distributions imply memorylessness; if a machine's failure probability increases with age, a Weibull with shape parameter β > 1 is more appropriate.
- Sensitivity analysis: Run the model with the top two or three candidate distributions and compare KPIs. If throughput predictions differ by less than 2%, the choice matters little; if they diverge significantly, invest in collecting more data.
Applying Fitted Distributions in FlexSim Models
Once a distribution is selected, FlexSim generates the corresponding expression string (e.g., lognormal(4.82, 0.31) or weibull(2.1, 180)) that can be pasted directly into any process time, inter-arrival time, or MTTR/MTBF field in the model. This tight integration eliminates transcription errors and ensures the model always reflects the analyst's chosen parameterization.
For failure modeling, the Input Analyzer is particularly valuable. Mean time between failures (MTBF) and mean time to repair (MTTR) are often assumed exponential by default, but real equipment frequently exhibits wear-out behavior. Fitting Weibull distributions to historical maintenance records and applying them to FlexSim's Resource failure parameters produces more realistic availability profiles and more accurate predictions of maintenance staffing requirements.
Handling Truncated and Censored Data
Shop-floor data is rarely clean. Common issues include:
- Left-truncated data: Cycle times below a sensor threshold are not recorded. Use the shift parameter in the lognormal or gamma fit to account for a non-zero minimum.
- Right-censored data: A job was still in process when the shift ended. FlexSim's Input Analyzer does not natively handle censored data; for such cases, export data to a statistical package (R's
fitdistrplus, Python'sscipy.stats) to obtain maximum-likelihood estimates, then manually enter the parameters into FlexSim. - Outliers: Extreme values caused by one-off events (power outages, material shortages) may distort fits. Document and justify any data points removed before fitting.
Practical Workflow Summary
- Export cycle-time, inter-arrival, and failure data from MES/OEE systems into CSV format.
- Load each dataset into the Input Analyzer; inspect histograms for multimodality or outliers.
- Fit distributions and review goodness-of-fit statistics and visual overlays.
- Validate the chosen distribution against domain knowledge and sensitivity analysis.
- Copy the generated expression string into the corresponding FlexSim model field.
- Document the source data, sample size, fitted distribution, and p-value in the model's metadata for audit purposes.
Further Resources
- FlexSim Documentation: Input Analyzer — Official reference covering all supported distributions and statistical tests.
- NIST/SEMATECH e-Handbook of Statistical Methods, Chapter 8 — Comprehensive background on distribution fitting and goodness-of-fit testing.
- Law, A.M. (2015). Simulation Modeling and Analysis, 5th ed., McGraw-Hill — The definitive textbook treatment of input modeling for discrete-event simulation.
- FlexSim Community Forum — Practitioner discussions on real-world input analysis challenges and solutions.
Investing time in rigorous input analysis is one of the highest-leverage activities in any simulation project. FlexSim's Input Analyzer lowers the barrier to doing this correctly, giving manufacturing engineers a statistically sound foundation for every model they build.