
Lean Waste Identification with Siemens Tecnomatix Plant Simulation: Value Stream Mapping and Muda Analysis
Manufacturing engineers tasked with continuous improvement initiatives often struggle to translate theoretical lean principles into quantifiable simulation experiments. Siemens Tecnomatix Plant Simulation bridges this gap by combining discrete-event simulation with built-in lean analysis tools, enabling practitioners to identify and quantify the seven classic wastes—muda—directly within a virtual production model before committing to physical changes.
Why Simulate Lean Analysis?
Traditional value stream mapping (VSM) is a static snapshot: it captures current-state flows on a whiteboard but cannot account for stochastic variability in cycle times, machine failures, or demand fluctuations. Plant Simulation extends VSM into a dynamic, probabilistic environment. Engineers can run hundreds of replications, observe how waste accumulates under real-world variability, and rank improvement opportunities by their expected impact on throughput and lead time—not just their theoretical potential.
Setting Up a Value Stream Map in Plant Simulation
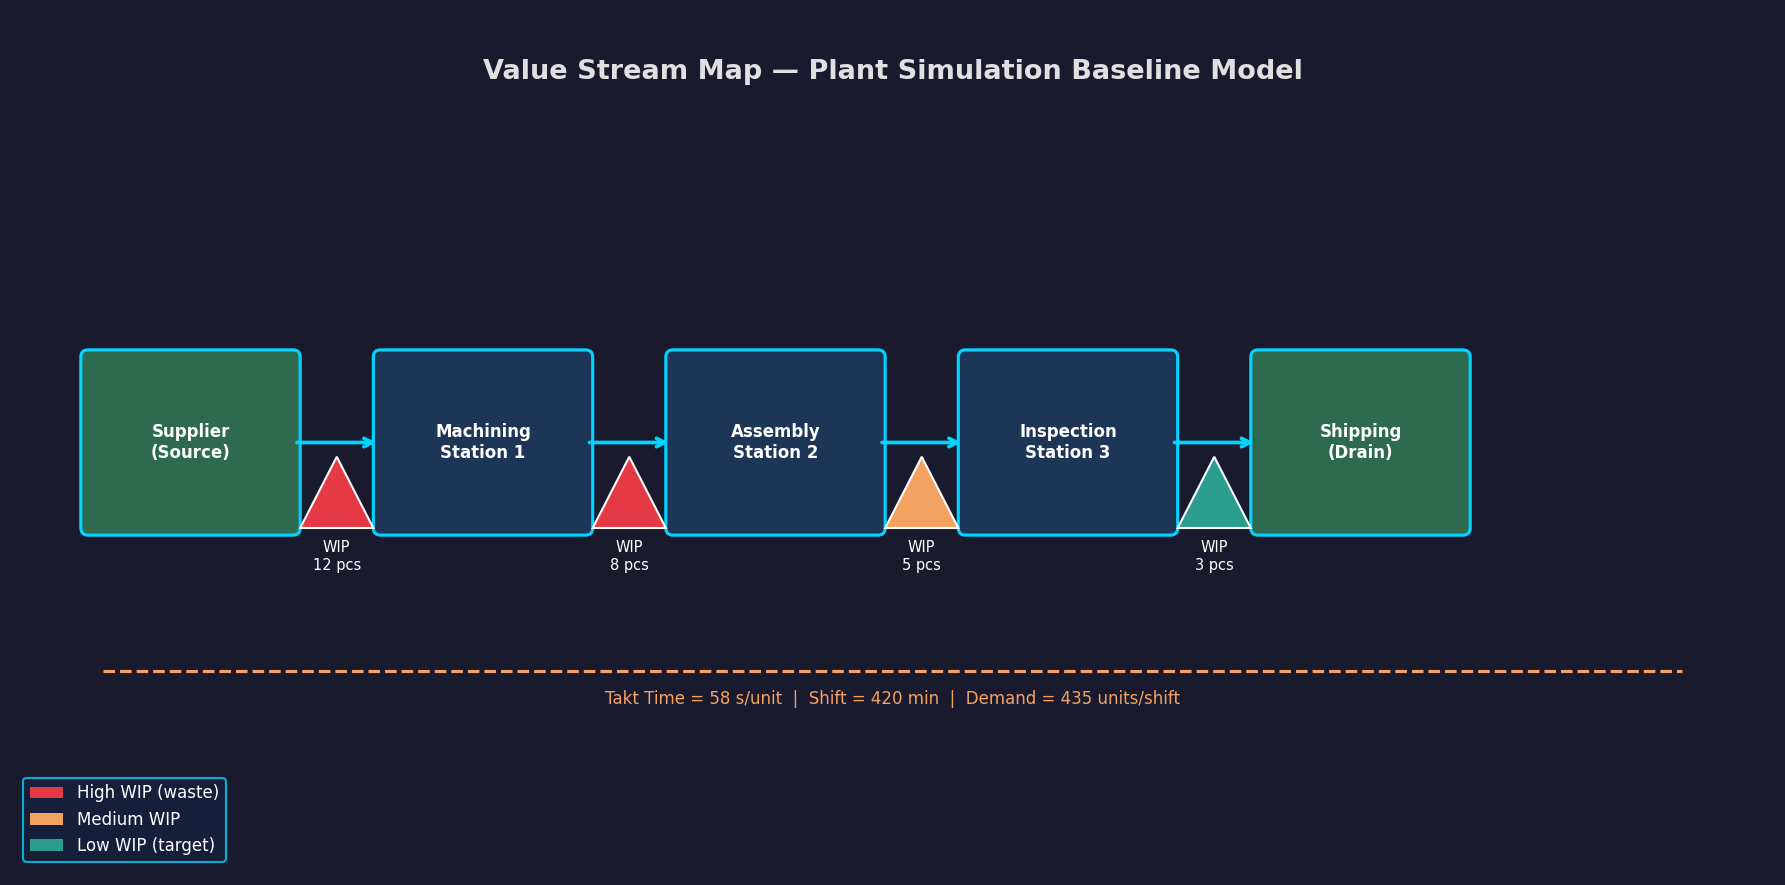
Plant Simulation's Material Flow library provides the core building blocks for a VSM-style model:

- Source and Drain objects represent customer demand and finished-goods shipping, respectively. Set the Source interarrival time to match your takt time (e.g., one unit every 58 seconds for a 420-minute shift producing 435 units).
- SingleProc and ParallelProc objects model individual workstations. Assign cycle time distributions (typically LogNormal or Weibull fitted to time-study data) rather than fixed values to capture natural process variation.
- Buffer objects between stations represent WIP inventory—a direct proxy for the waiting and inventory wastes.
- Worker objects with shift calendars model labor availability, exposing motion and waiting wastes caused by staffing imbalances.
Once the baseline model is validated against actual throughput and WIP levels (use the Statistics object to compare simulated vs. observed cycle times), you are ready for lean analysis.
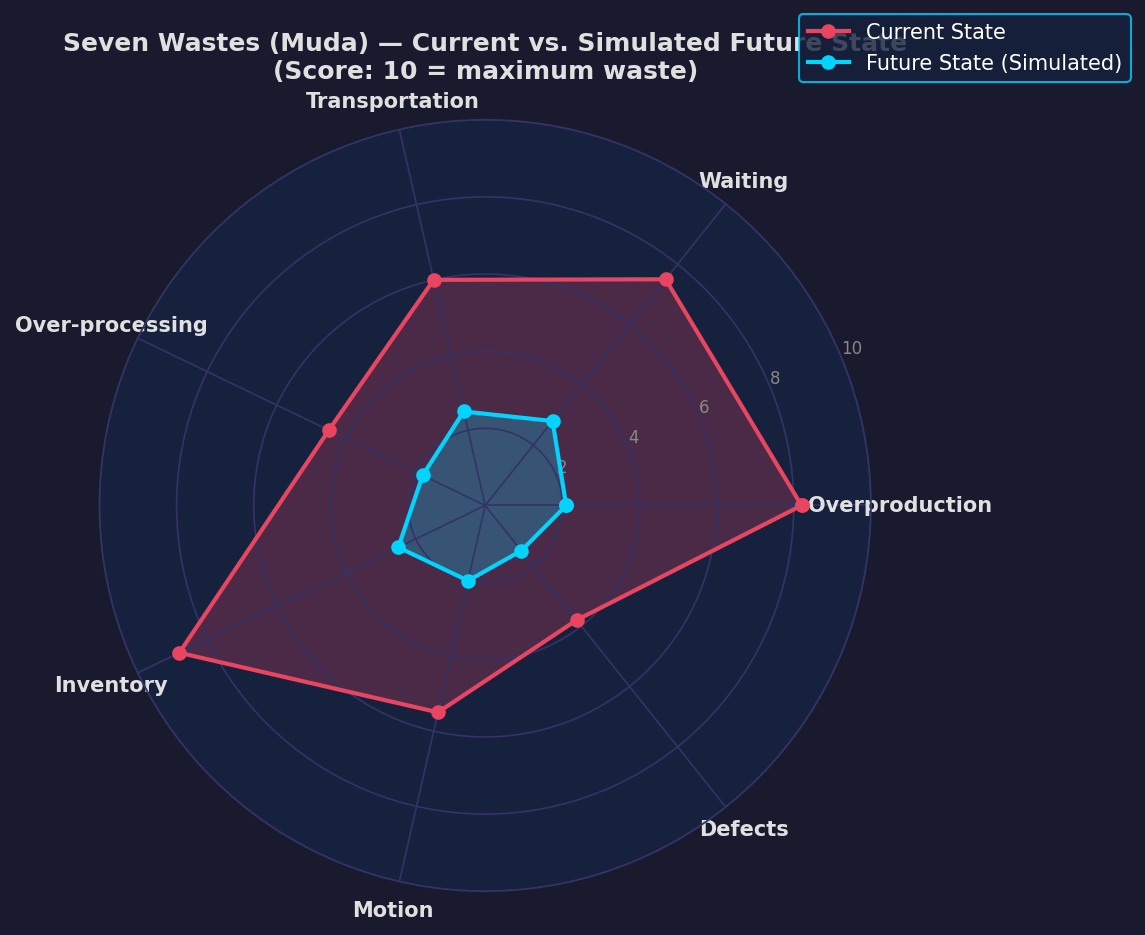
Quantifying the Seven Wastes
1. Overproduction
Enable the Throughput Chart on each station. Stations producing faster than downstream demand generate push-type overproduction. Plant Simulation's Gantt chart view reveals extended green (active) bars at upstream stations while downstream buffers fill—a clear visual indicator. Quantify overproduction by logging the number of parts entering a buffer beyond its target WIP level using a TableFile and a custom SimTalk method:
if Buffer_1.content > WIP_target then
    overproduction_count := overproduction_count + 1
end
2. Waiting
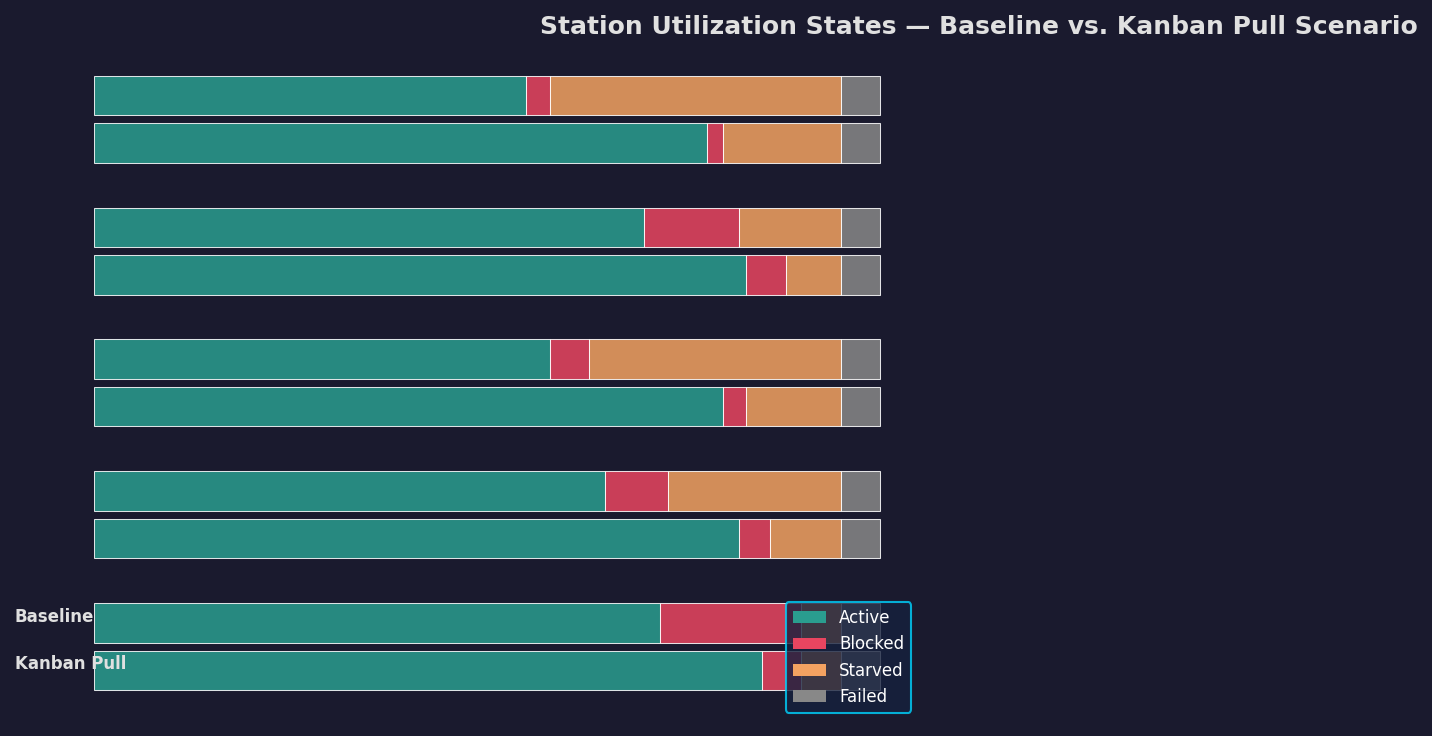
The Utilization Statistics panel reports the percentage of time each object spends in blocked, starved, or failed states. Waiting waste at a workstation equals its starved-time percentage multiplied by the simulation duration. Stations with >15% starvation are prime candidates for upstream buffer resizing or cycle-time rebalancing.
3. Transportation
Model internal material handling with Transporter and Track objects. Plant Simulation's 3D visualization renders travel paths, making excessive transport distances immediately apparent. Use the built-in Distance Traveled statistic on Transporter objects to calculate total transport waste in meter-hours per shift.
4. Over-processing
Over-processing is harder to detect automatically—it requires domain knowledge embedded in the model. Tag operations with a custom attribute is_value_added (Boolean). At simulation end, sum cycle times for non-value-added operations across all parts using a TableFile aggregation to compute the over-processing ratio.
5. Inventory (WIP)
Buffer content statistics are logged automatically. Plot WIP over time using the Chart object connected to each Buffer's content attribute. Little's Law provides a cross-check: if average WIP divided by throughput rate does not match observed lead time, the model needs recalibration.
6. Motion
Assign Worker objects to multiple stations and enable path recording. The Heatmap visualization (available in Plant Simulation 16+) overlays worker movement density on the 2D layout, highlighting excessive walking distances. Compare total worker travel distance between the current-state and proposed-state models.
7. Defects
Model rework loops by routing a percentage of parts (based on historical first-pass yield data) back to an earlier station via a Method object. Track rework volume and its downstream impact on throughput using a dedicated Counter object.
Running the Lean Improvement Experiment
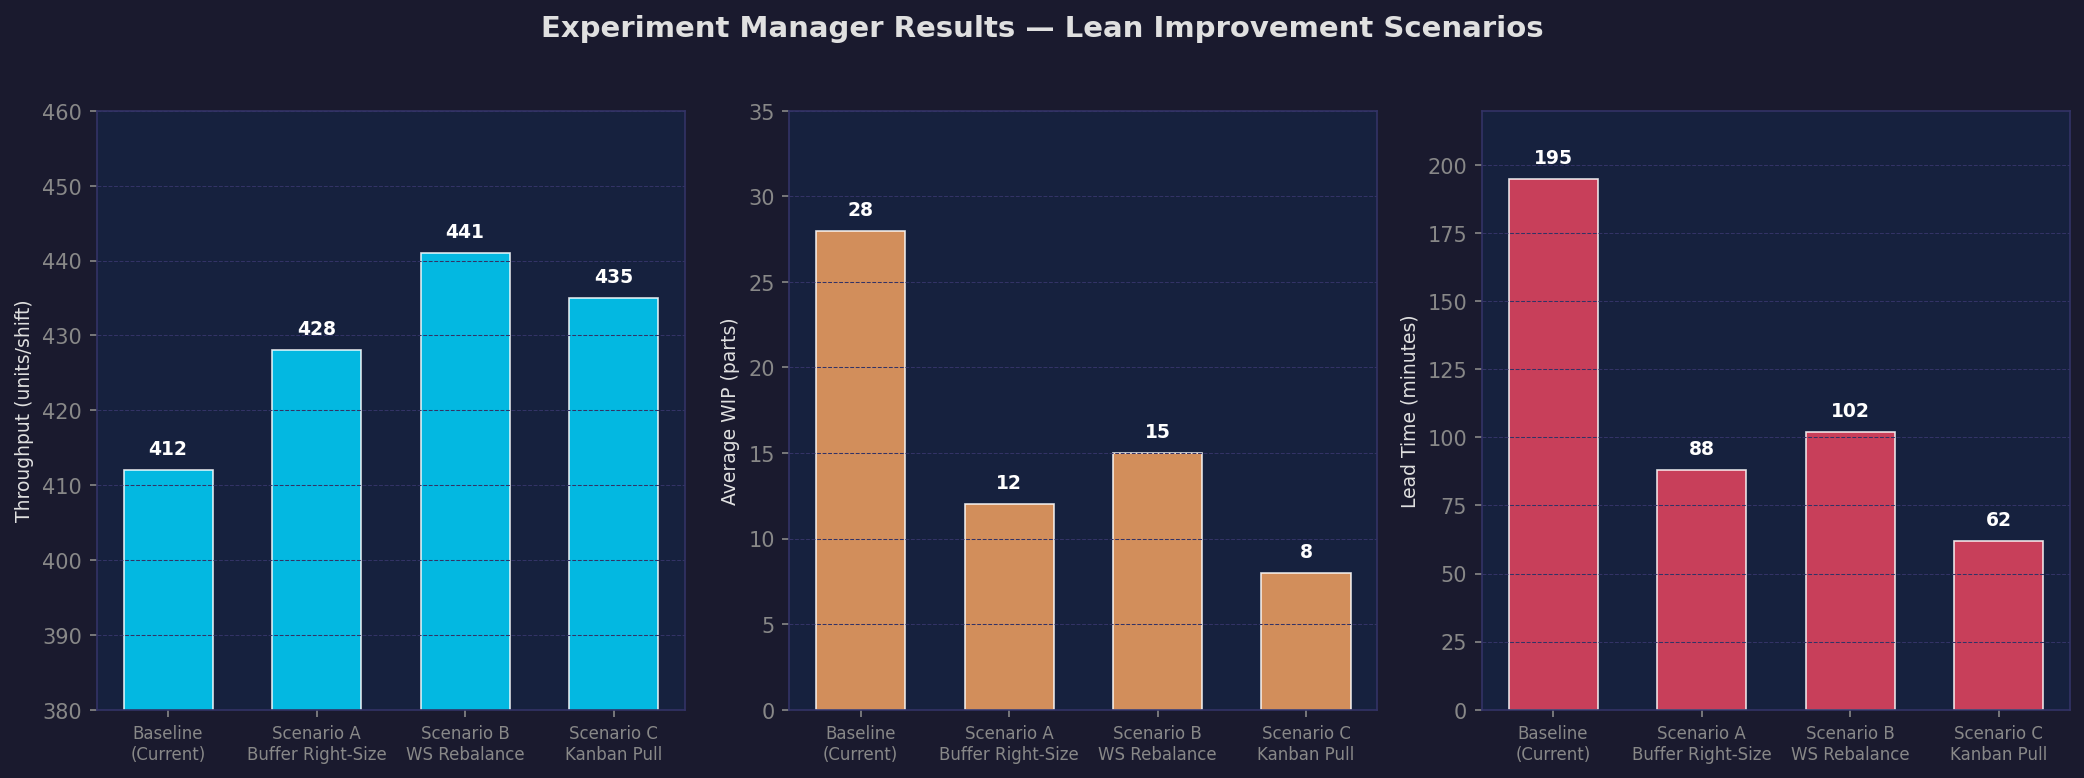
With waste quantified in the baseline model, use Plant Simulation's Experiment Manager to test improvement scenarios systematically:
- Scenario A – Buffer Right-Sizing: Reduce inter-station buffers to one-piece flow and observe the effect on lead time and WIP.
- Scenario B – Workstation Rebalancing: Redistribute cycle time from the bottleneck station to adjacent stations and measure throughput gain.
- Scenario C – Kanban Pull System: Replace push logic with a kanban signal (modeled via a SimTalk event triggered when downstream buffer drops below a reorder point) and compare WIP levels.
The Experiment Manager generates a results table comparing KPIs—throughput, average WIP, lead time, and utilization—across all scenarios, enabling data-driven prioritization of lean initiatives.
Interpreting Results and Reporting
Export the results table to Excel via Plant Simulation's ExcelFile object for integration into A3 reports or VSM future-state documentation. The Sankey diagram complements lean waste analysis by visualizing material flow volumes and highlighting where flow is interrupted.
Key Takeaways
- Plant Simulation transforms static VSM into a stochastic, dynamic analysis tool capable of quantifying all seven lean wastes under realistic variability.
- Built-in statistics objects (Utilization, Throughput Chart, Gantt) provide waste metrics without custom coding for most waste categories.
- The Experiment Manager enables rigorous A/B comparison of lean improvement scenarios before physical implementation.
- Combining lean waste analysis with bottleneck identification (Sankey diagrams) and shift calendar modeling creates a comprehensive continuous-improvement simulation framework.