
EPIC Model: Simulating Soil Erosion and Carbon Sequestration for Sustainable Land Management
The Environmental Policy Integrated Climate (EPIC) model is one of the most comprehensive and widely validated tools available for simulating the long-term interactions between agricultural management, soil health, and carbon dynamics. Originally developed by the USDA Agricultural Research Service in the 1980s, EPIC has evolved into a powerful platform for evaluating soil erosion risk, organic carbon sequestration potential, and the environmental consequences of land management decisions at the field to regional scale.
What EPIC Models and Why It Matters
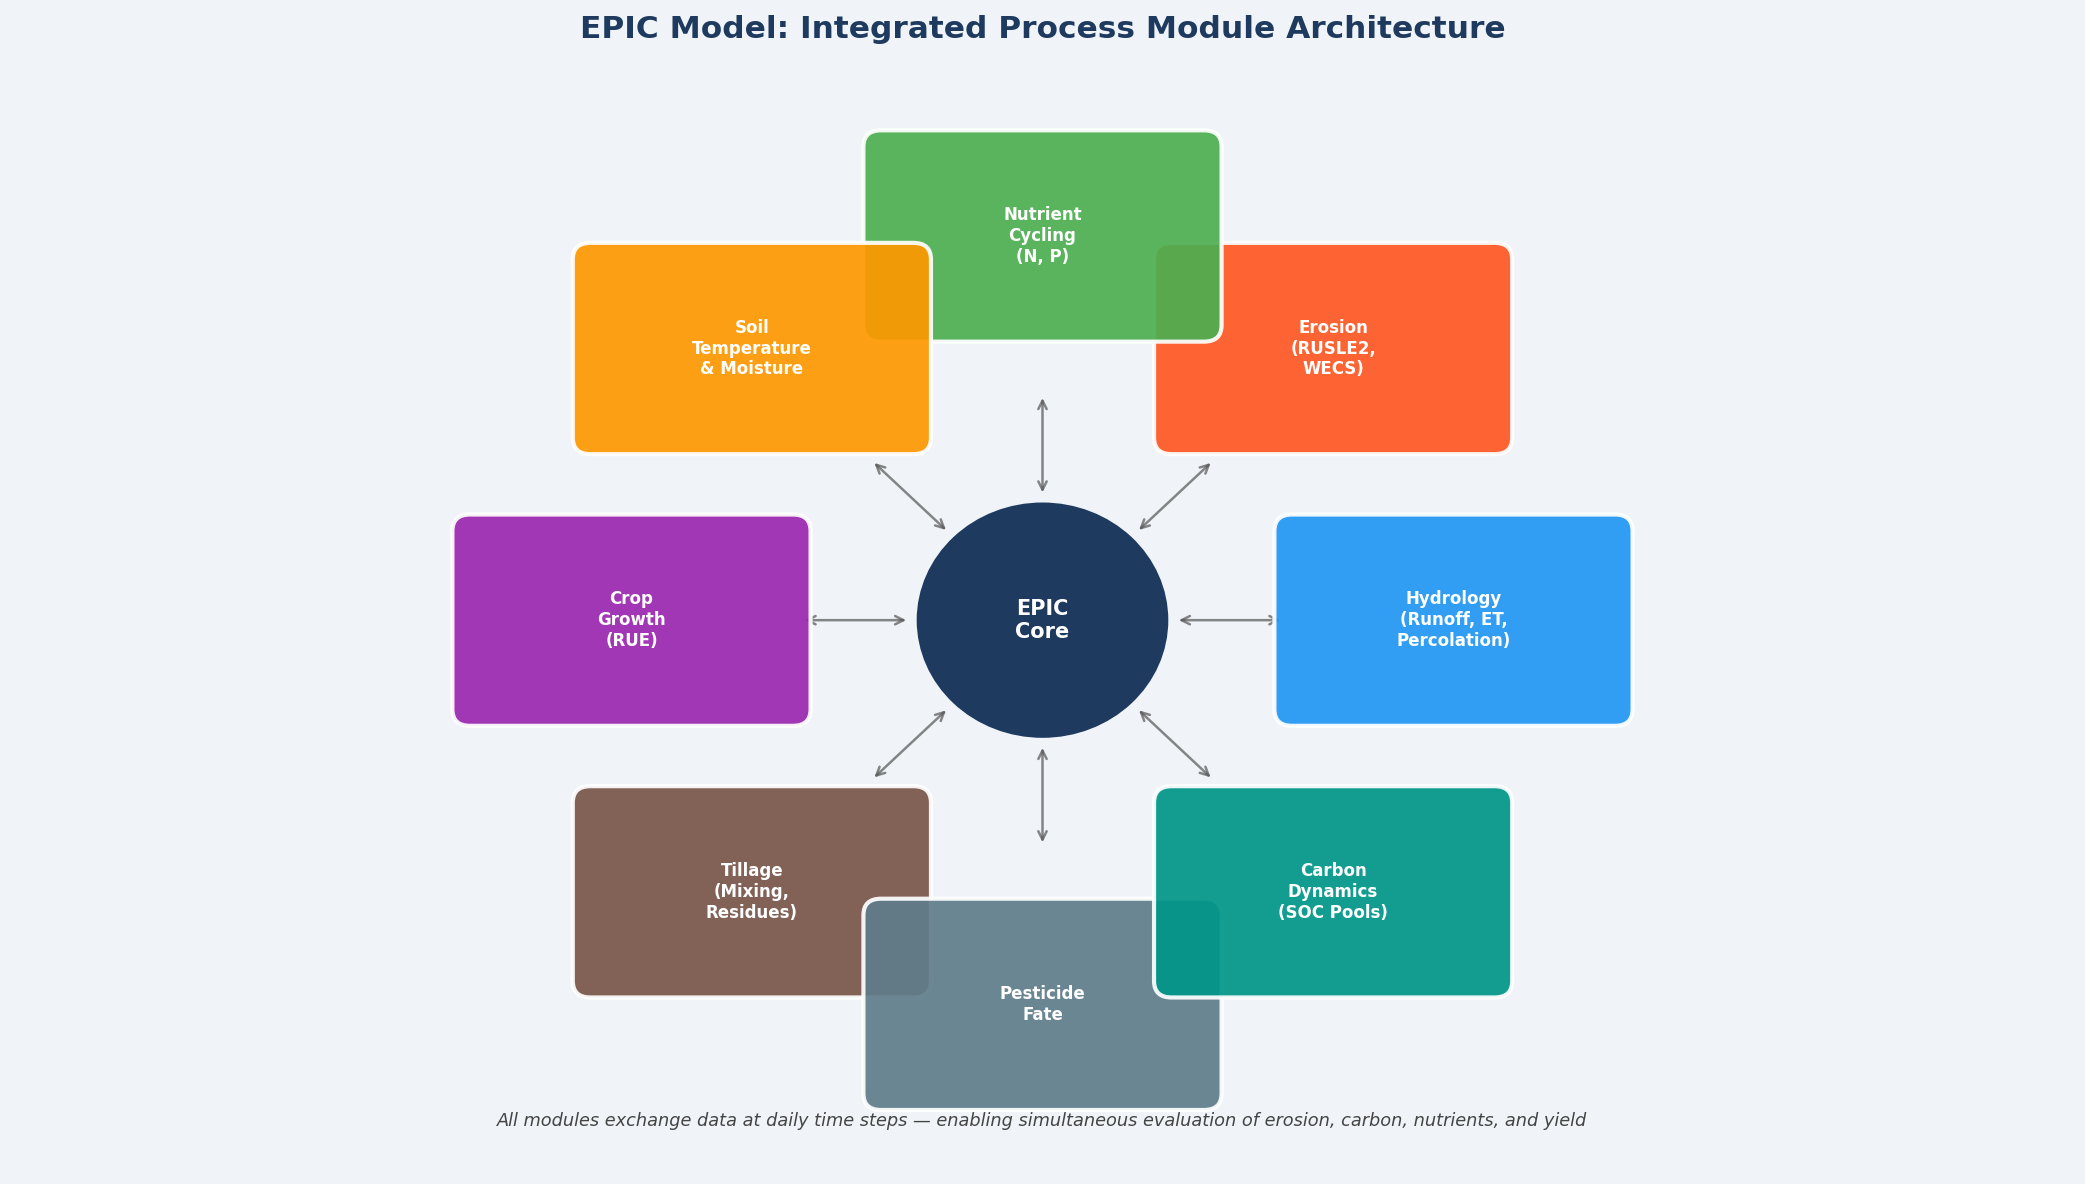
Unlike simpler crop models that focus primarily on yield prediction, EPIC integrates eight major process domains into a single simulation framework:
- Hydrology – surface runoff, lateral flow, percolation, and evapotranspiration
- Erosion – water erosion (USLE/RUSLE-based), wind erosion (WECS/WEQ), and tillage erosion
- Nutrient cycling – nitrogen and phosphorus transformations, leaching, and volatilization
- Soil temperature and moisture – layered soil profile dynamics
- Crop growth – radiation-use efficiency, phenology, and biomass partitioning
- Tillage – mechanical mixing and residue incorporation
- Pesticide fate – transport and degradation
- Carbon dynamics – soil organic carbon (SOC) decomposition and sequestration
This integration makes EPIC uniquely suited for policy-level analyses where trade-offs between productivity, erosion control, and greenhouse gas mitigation must be quantified simultaneously.

Soil Erosion Simulation: The RUSLE2 Integration
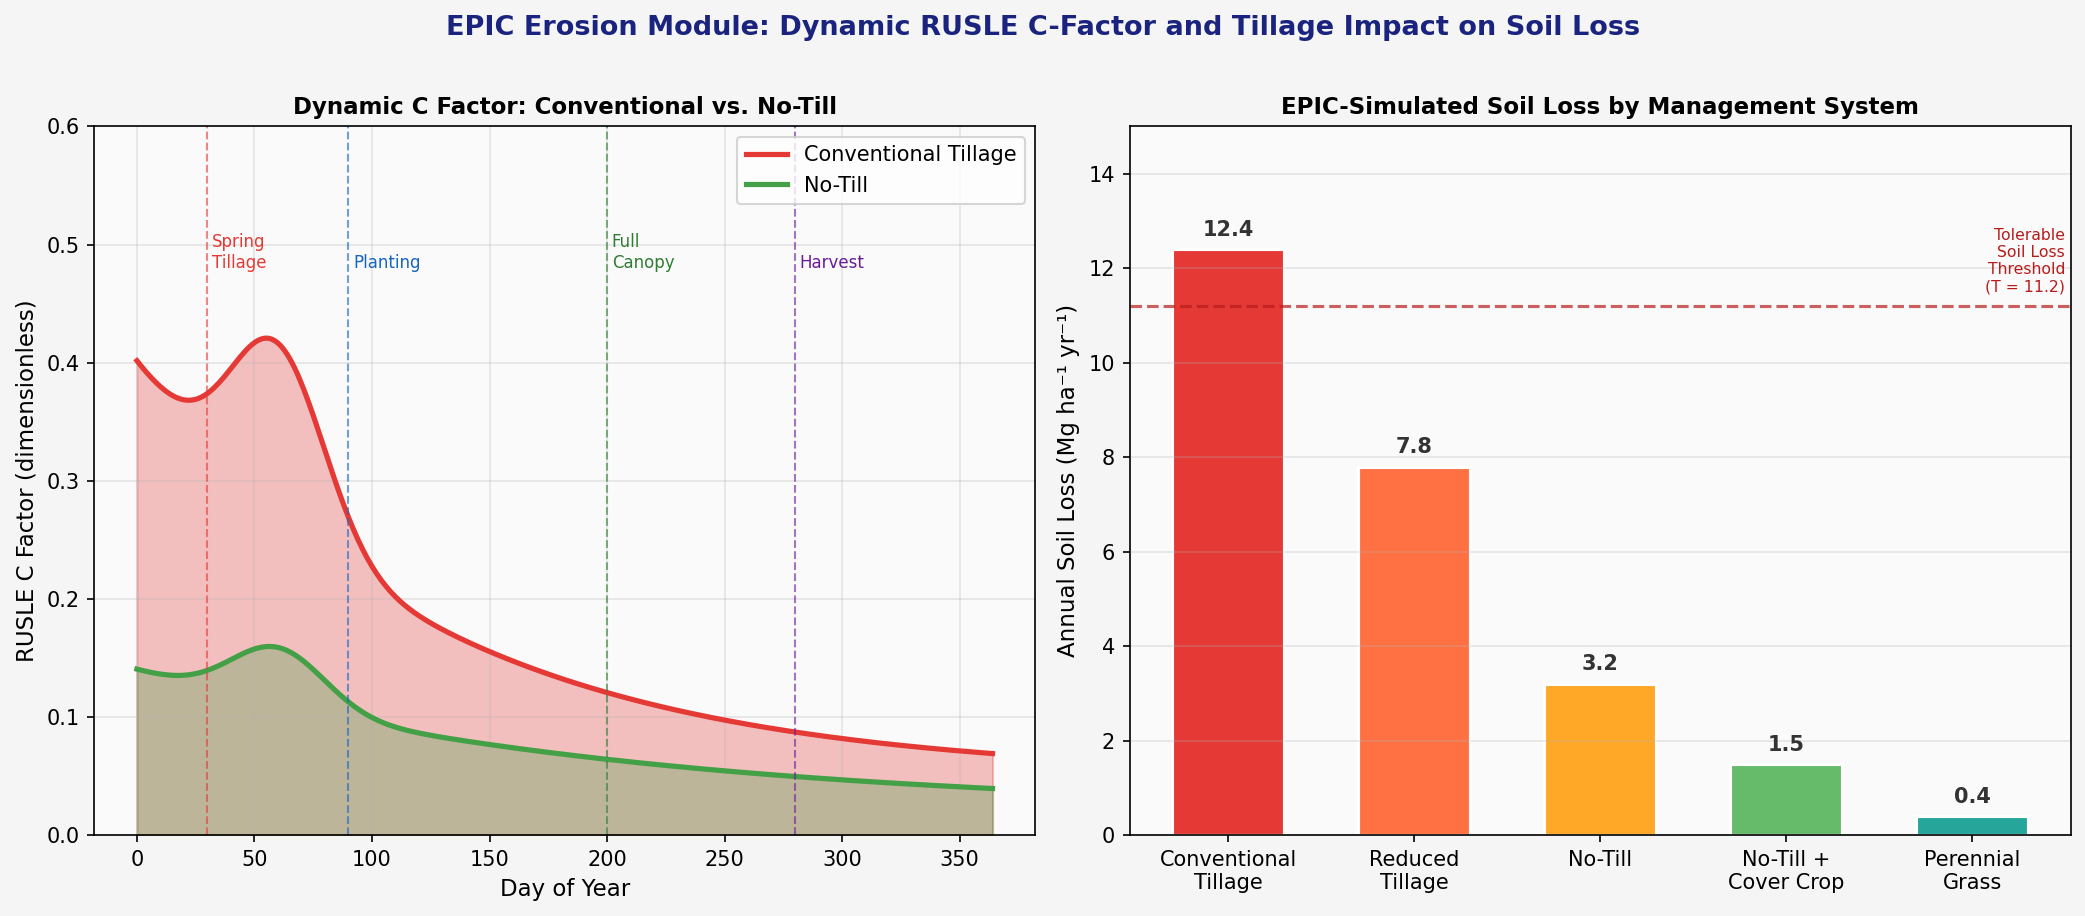
EPIC's erosion module is built around the Revised Universal Soil Loss Equation (RUSLE2) framework, extended with process-based enhancements. The model computes erosion on a daily time step using:
A = R × K × LS × C × PWhere R is the rainfall erosivity factor (computed dynamically from simulated daily precipitation), K is the soil erodibility factor (updated annually as SOC changes), LS is the slope length-steepness factor, C is the cover-management factor (updated daily based on crop canopy and residue cover), and P is the support practice factor.
A critical advantage of EPIC over static RUSLE applications is that the C factor is dynamic — it responds to simulated crop growth, residue decomposition, and tillage events in real time. This means that a no-till scenario with high residue cover will show measurably lower erosion rates compared to conventional tillage, and the model will simultaneously track how that residue affects soil moisture, nitrogen availability, and SOC accumulation.
For wind erosion, EPIC implements the Wind Erosion Continuous Simulation (WECS) approach, accounting for wind speed, soil surface roughness, aggregate stability, and vegetative barriers. This is particularly valuable for dryland farming systems in semi-arid regions.
Carbon Sequestration Modeling
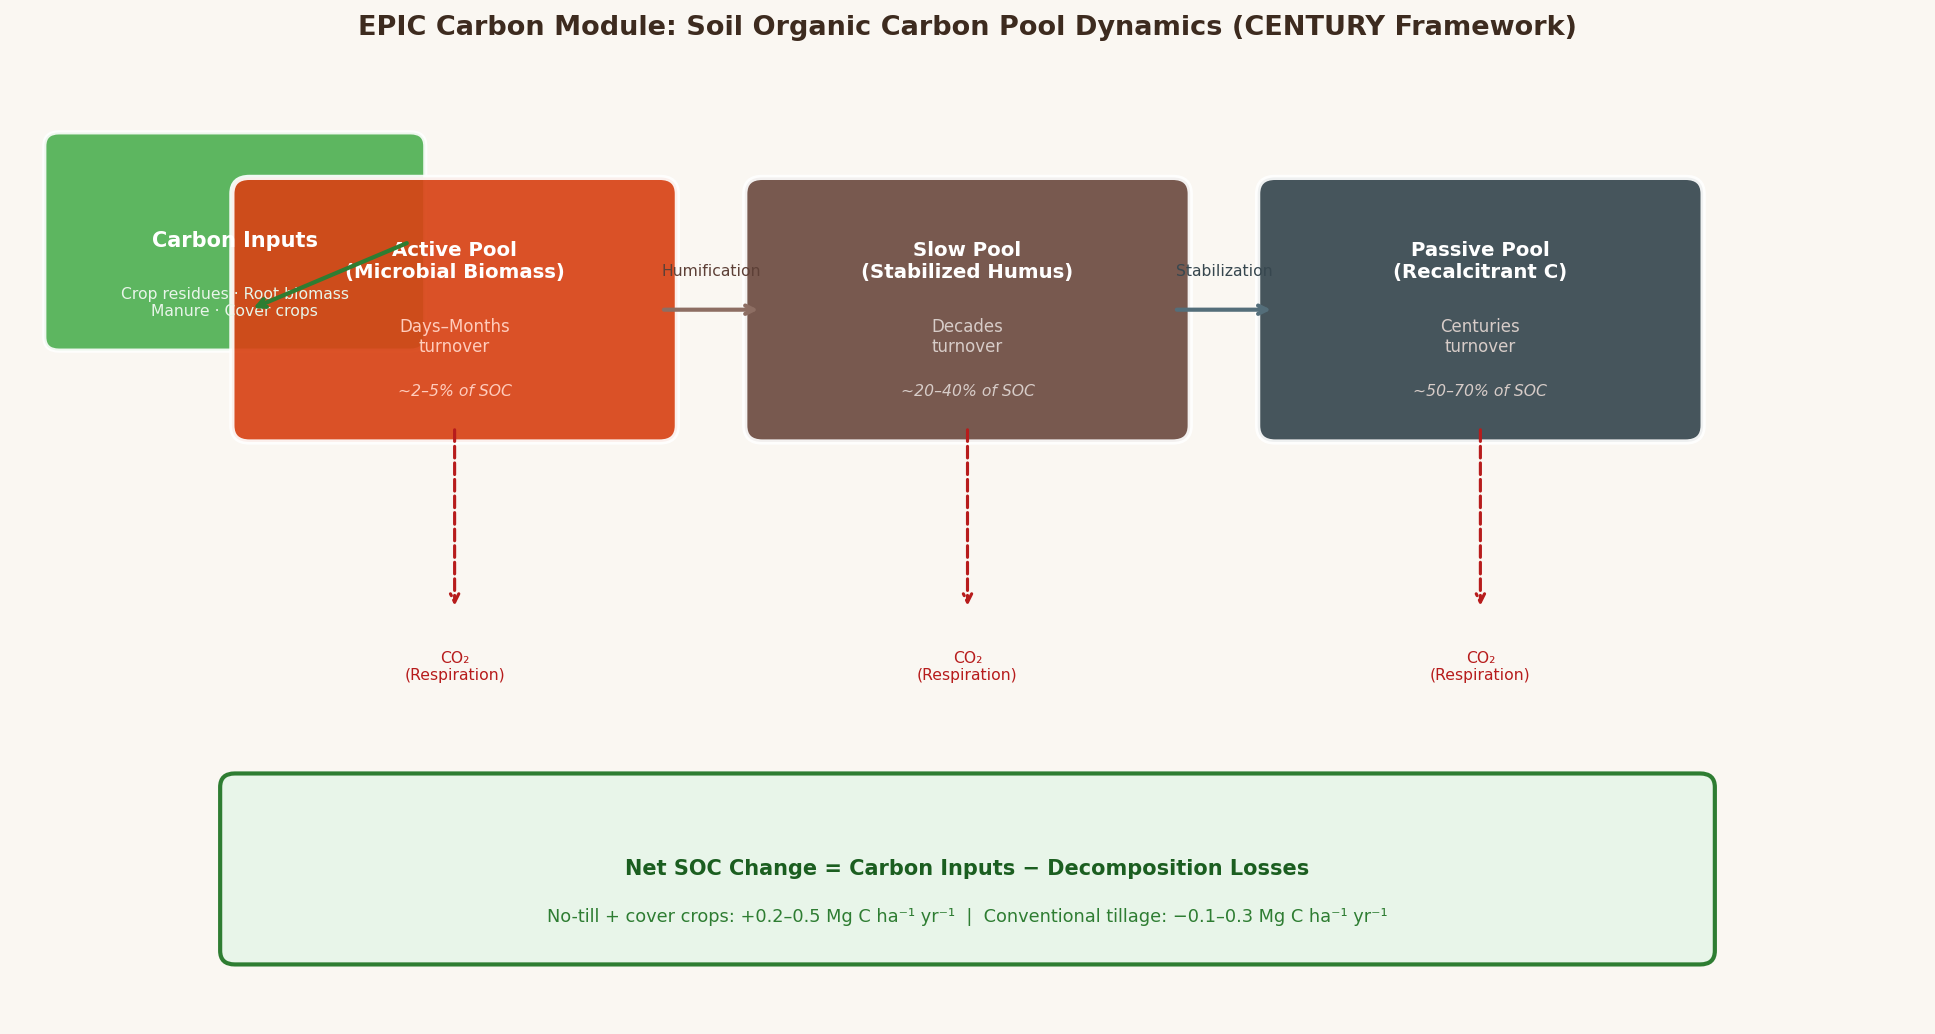
EPIC's soil organic carbon module uses a modified version of the CENTURY decomposition framework, partitioning SOC into three pools:
| Pool | Turnover Rate | Description |
|---|---|---|
| Active (microbial biomass) | Days to months | Rapidly cycling fraction |
| Slow (stabilized humus) | Decades | Physically protected fraction |
| Passive (recalcitrant) | Centuries | Chemically stabilized fraction |
Carbon inputs from crop residues, root biomass, and manure applications are allocated among these pools based on lignin content and C:N ratios. The model tracks net SOC change annually, enabling practitioners to evaluate whether a given management system is a net carbon source or sink over multi-decade simulation horizons.
Practical application: A typical EPIC analysis comparing conventional tillage versus no-till corn-soybean rotation over 30 years might show SOC increases of 0.2–0.5 Mg C ha⁻¹ yr⁻¹ under no-till, depending on climate and initial soil conditions. These outputs can be directly linked to carbon credit verification protocols such as those used by the Verified Carbon Standard (VCS) or the USDA's Greenhouse Gas Technical Assistance Provider and Third-Party Verifier (GHG-TAPV) program.
Setting Up an EPIC Simulation: Key Inputs
A well-configured EPIC run requires the following input datasets:
- Soil profile data – Horizon-by-horizon texture, bulk density, organic carbon, pH, and hydraulic conductivity. The SSURGO database (US) or FAO World Soil Database are standard sources.
- Daily weather – Precipitation, maximum/minimum temperature, solar radiation, wind speed, and relative humidity. EPIC includes a stochastic weather generator (WXGEN) for gap-filling or synthetic scenario generation.
- Management schedule – Planting dates, tillage operations, fertilizer applications, irrigation events, and harvest dates. These are encoded in EPIC's operation schedule files (.OPC).
- Crop parameters – EPIC ships with parameter sets for over 100 crops; custom cultivars can be calibrated using observed biomass and yield data.
- Topographic data – Field slope, slope length, and aspect, typically derived from a DEM.
The APEX (Agricultural Policy/Environmental eXtender) model extends EPIC to watershed scale by routing outputs from multiple EPIC fields through a channel network, making it suitable for sub-watershed BMP analysis.
Calibration and Validation Best Practices
EPIC's large parameter space requires systematic calibration. Recommended workflow:
- Fix non-sensitive parameters first using literature values or SSURGO defaults.
- Calibrate crop growth parameters (radiation use efficiency, harvest index) against observed yield data before proceeding to soil parameters.
- Calibrate hydrology (curve number, soil evaporation coefficient) against measured runoff or streamflow.
- Calibrate erosion parameters (USLE_P, USLE_C) against measured sediment loads.
- Validate SOC trends against long-term experimental data (e.g., Rothamsted, Morrow Plots).
Sensitivity analysis tools such as SWAT-CUP (adapted for EPIC workflows) or Python-based PEST interfaces can automate parameter estimation. Published studies consistently show that EPIC achieves Nash-Sutcliffe efficiencies of 0.6–0.85 for annual runoff and 0.55–0.75 for sediment yield when properly calibrated.
Integration with GIS and Remote Sensing
Modern EPIC workflows increasingly leverage GIS and remote sensing for input preparation and output visualization:
- SSURGO-to-EPIC translators automate soil input file generation from Web Soil Survey downloads.
- Cropland Data Layer (CDL) integration enables automated management schedule assignment across large spatial domains.
- MODIS LAI products can be used to validate simulated canopy development.
- Sentinel-2 NDVI time series provide independent validation of simulated crop growth trajectories.
The EPIC-APEX model interface within ArcGIS and QGIS environments allows spatial aggregation of field-scale outputs to produce watershed-level erosion risk maps and SOC change maps suitable for policy reporting.
Limitations and Complementary Tools
EPIC is not a substitute for process-based models in all contexts. Key limitations include:
- No explicit lateral flow routing at field scale (use APEX or SWAT+ for watershed routing)
- Simplified atmospheric CO₂ feedback (crop growth responds to elevated CO₂ but atmospheric chemistry is not modeled)
- Limited representation of perennial systems – orchards, vineyards, and agroforestry require custom parameterization
For watershed-scale water quality analysis, SWAT+ (covered separately on this site) is often preferred. For detailed soil carbon modeling with explicit microbial dynamics, DayCent or RothC may provide higher fidelity. EPIC's strength lies in its breadth — the ability to simultaneously evaluate erosion, carbon, nutrients, and yield under diverse management scenarios within a single, validated framework.
Getting Started with EPIC
- Download: EPIC and APEX are freely available from the USDA ARS Grassland, Soil and Water Research Laboratory
- Documentation: The EPIC User Manual (Williams et al., 2012) provides complete parameter descriptions and equation derivations
- Community: The EPIC-APEX user community forum at Texas A&M AgriLife Research hosts calibration datasets and model updates
- Training: USDA NRCS offers periodic workshops on EPIC application for conservation planning
EPIC remains one of the most powerful and scientifically validated tools in the agricultural simulation toolkit. For professionals working on soil health policy, carbon market verification, or conservation practice evaluation, mastering EPIC's erosion and carbon modules provides a significant analytical advantage.