
GLEAM 3.0: Simulating Livestock Greenhouse Gas Emissions at Global and Regional Scale
The livestock sector contributes approximately 14.5% of global anthropogenic greenhouse gas (GHG) emissions, according to FAO estimates. For policy analysts, sustainability consultants, and agricultural engineers tasked with designing mitigation strategies, a rigorous simulation tool is essential. The Global Livestock Environmental Assessment Model (GLEAM), developed and maintained by the FAO, provides exactly that: a spatially explicit, process-based framework for quantifying GHG emissions across the entire livestock supply chain — from feed production through to post-farm-gate processing.
What Is GLEAM?
GLEAM is a life-cycle assessment (LCA) model implemented in a geographic information system (GIS) environment. Version 3.0, released in 2023, covers eight livestock species (cattle, buffalo, sheep, goats, pigs, chickens, ducks, and turkeys) across all major production systems globally. The model operates at a 5-arcminute spatial resolution (~10 km at the equator), enabling sub-national analysis in data-rich regions.
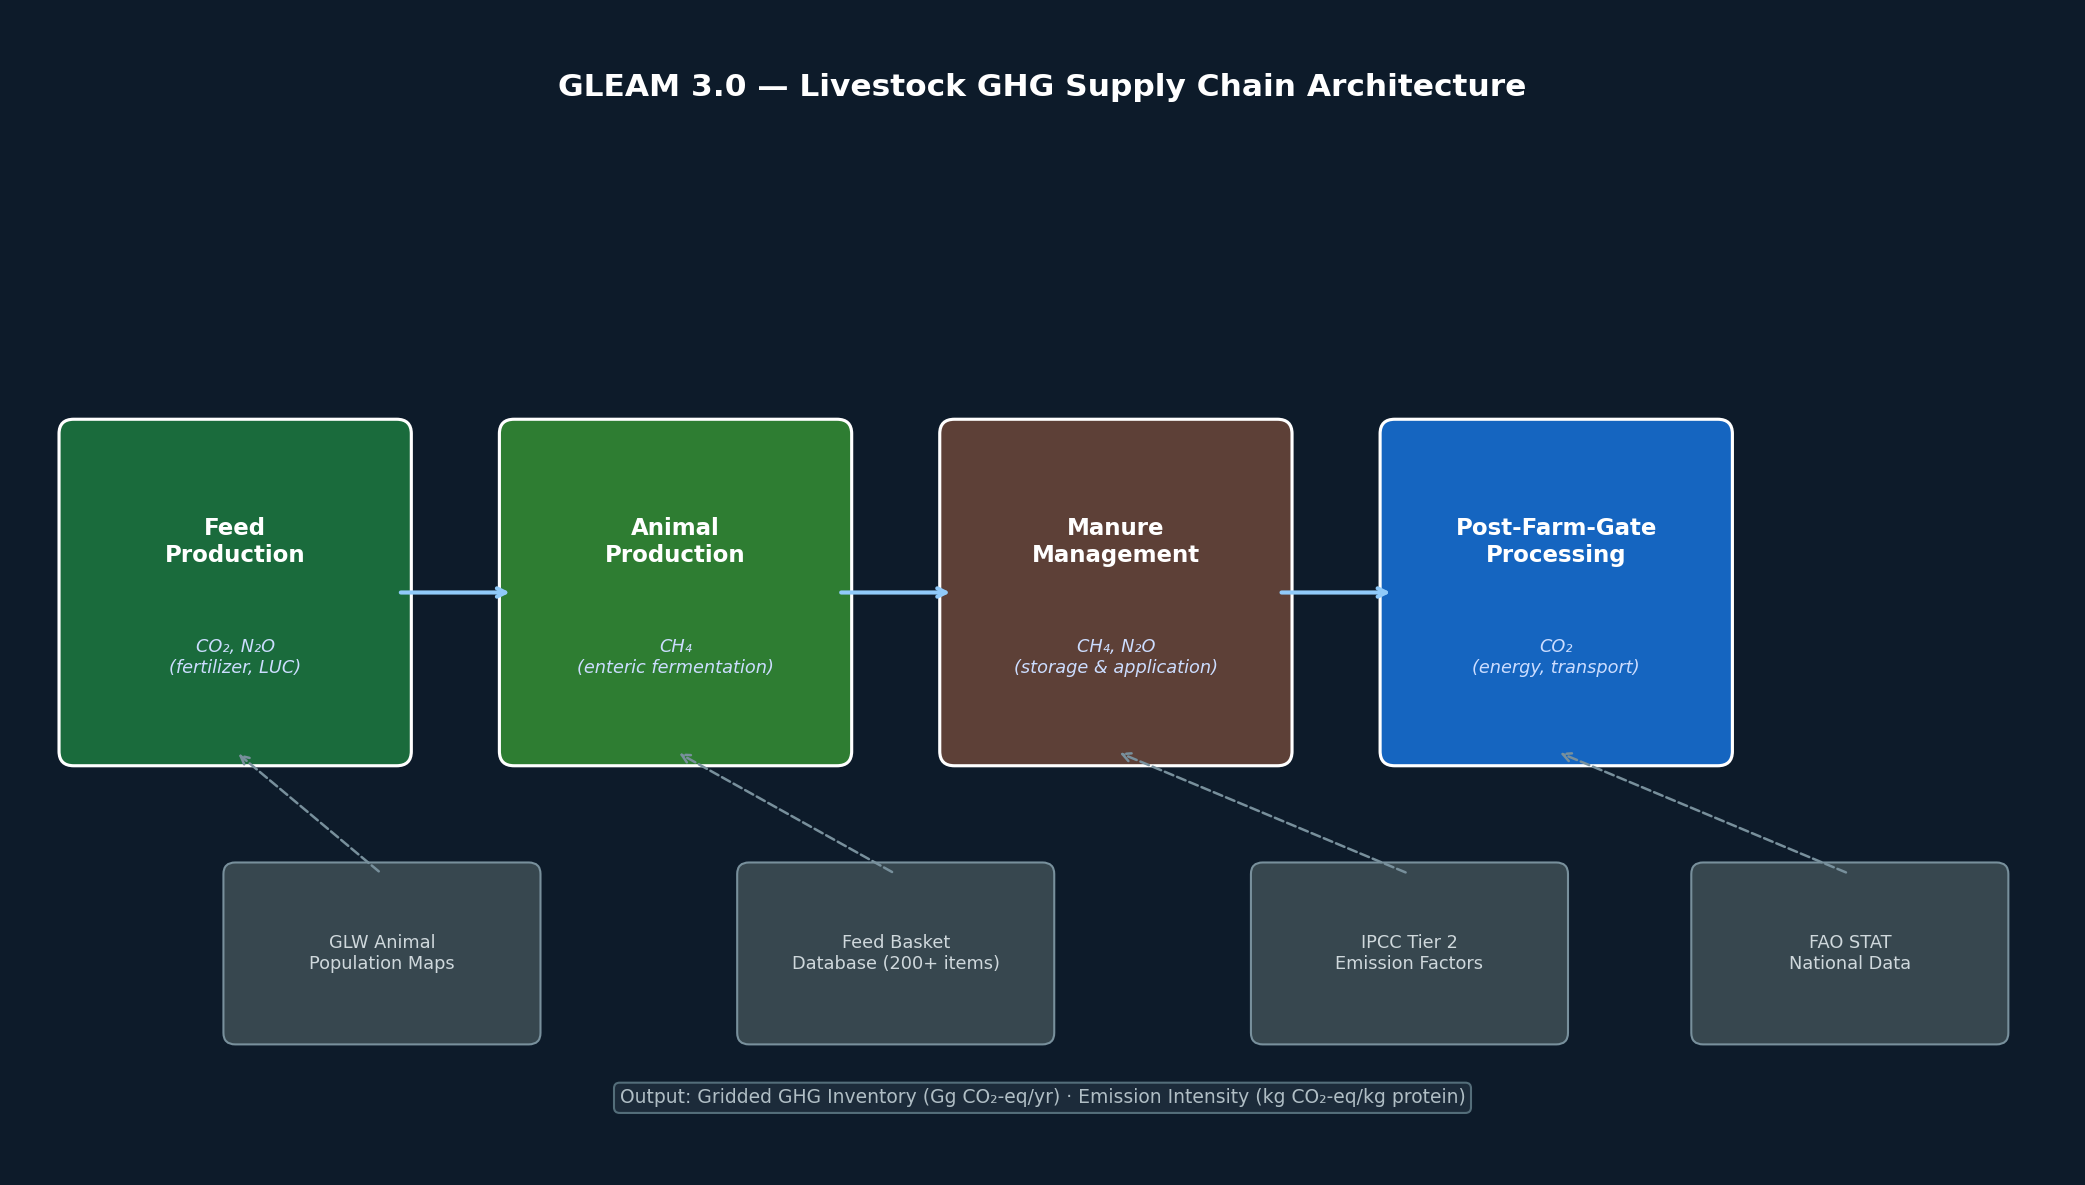
The core emission sources modeled include:
- Enteric fermentation — methane (CH₄) from ruminant digestion, calculated using IPCC Tier 2 emission factors adjusted for feed digestibility and animal productivity
- Manure management — CH₄ and nitrous oxide (N₂O) from manure storage and application, differentiated by management system (lagoon, composting, pasture deposition, etc.)
- Feed production — CO₂, CH₄, and N₂O from crop cultivation, synthetic fertilizer manufacture, and land-use change associated with feed crops
- Land-use change (LUC) — CO₂ emissions from deforestation and grassland conversion attributed to feed crop expansion
- Post-farm-gate processing — energy-related emissions from slaughter, refrigeration, and transport
Core Architecture and Data Inputs
GLEAM integrates three primary data layers:
- Livestock distribution maps — gridded animal population data from the Gridded Livestock of the World (GLW) database, disaggregated by production system (grassland-based, mixed crop-livestock, industrial)
- Feed basket data — species- and system-specific feed rations derived from national statistics and expert elicitation, covering over 200 feed commodities
- Emission factor libraries — IPCC Tier 2 parameters for enteric fermentation and manure management, supplemented by peer-reviewed meta-analyses
The model uses a mass-flow approach: it tracks the flow of nitrogen and carbon through the animal, manure, and soil subsystems, ensuring mass balance consistency across the supply chain. This is a significant methodological advantage over simpler activity-based inventories.
Key Analytical Capabilities
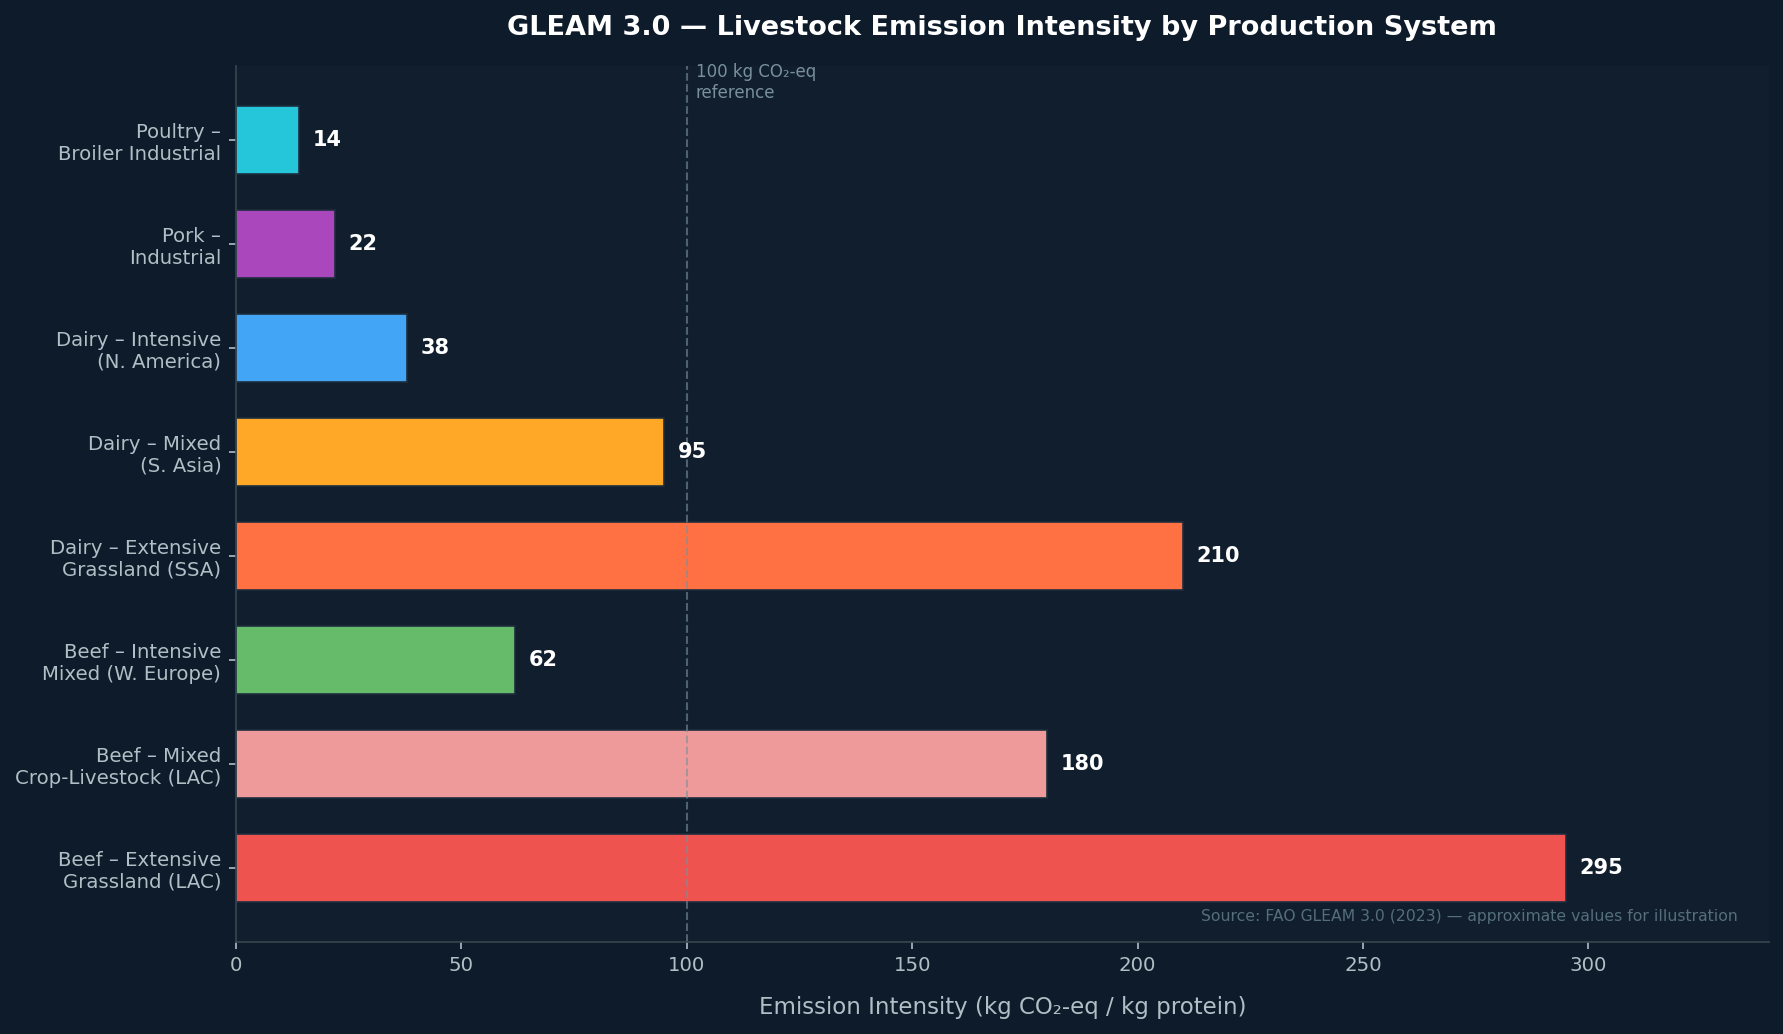
Emission Intensity Benchmarking
GLEAM calculates emission intensity — GHG emissions per kilogram of protein or per kilogram of carcass weight — for each species, production system, and region. This metric is critical for comparing the climate performance of different livestock systems and identifying high-impact intervention points. For example, GLEAM 3.0 data show that beef from extensive grassland systems in Latin America carries an emission intensity roughly 3–5× higher than beef from intensive mixed systems in Western Europe, primarily due to lower productivity and higher enteric fermentation per unit of output.
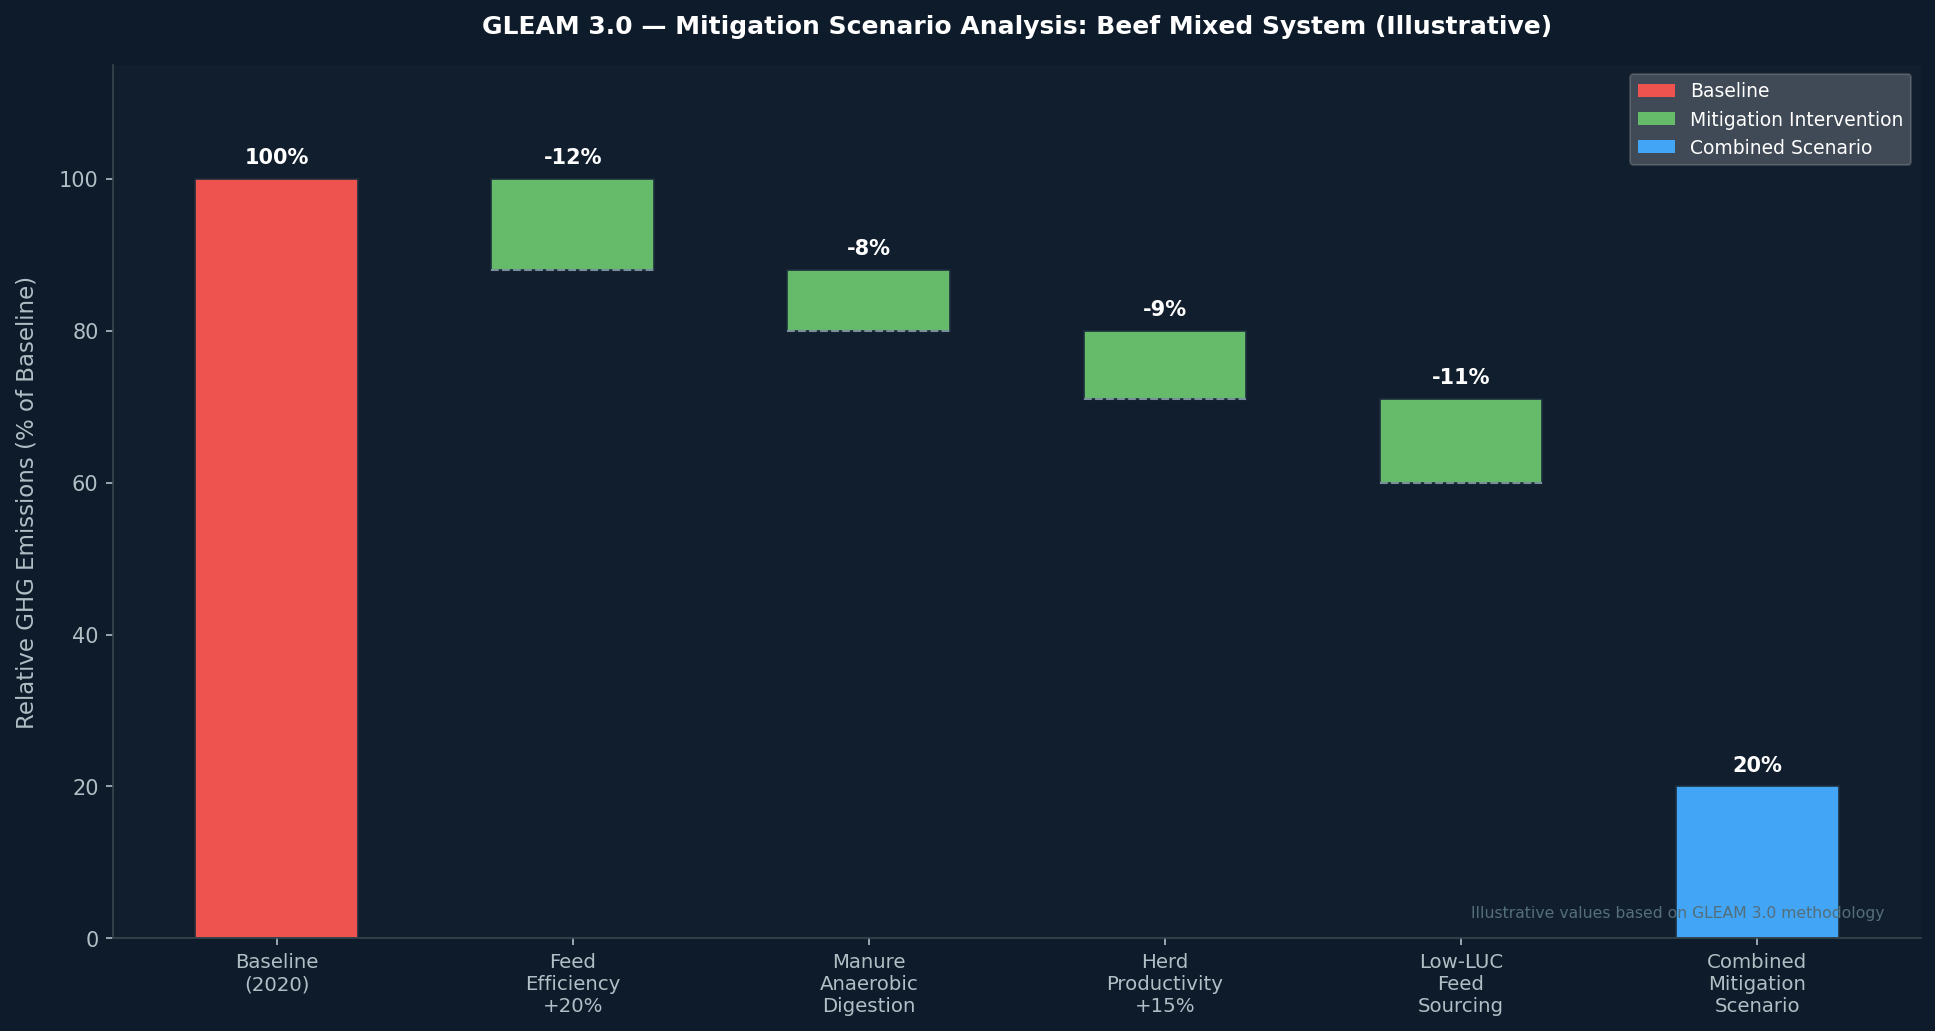
Scenario and Mitigation Analysis
GLEAM supports counterfactual scenario analysis by allowing users to modify key parameters:
- Feed efficiency improvements — adjusting feed conversion ratios (FCR) to simulate genetic improvement or precision feeding
- Manure management transitions — shifting from open lagoon storage to anaerobic digestion with biogas capture
- Herd productivity changes — increasing offtake rates or milk yields to reduce the emission intensity of the breeding herd
- Dietary substitution — replacing high-LUC feed commodities (e.g., soy from deforested areas) with lower-impact alternatives
Each scenario produces a full GHG inventory breakdown, allowing analysts to quantify the marginal abatement potential of each intervention.
Spatial Disaggregation and Hotspot Identification
Because GLEAM operates at grid-cell resolution, it can identify geographic emission hotspots — areas where high livestock density, low productivity, and high-LUC feed sourcing combine to produce disproportionate emissions. This spatial output is directly usable in GIS platforms (ArcGIS, QGIS) for integration with land-use planning and conservation priority mapping.
Practical Workflow for Technical Users
A typical GLEAM analysis for a national mitigation assessment follows these steps:
- Define the system boundary — select species, production systems, and geographic scope
- Validate baseline inputs — cross-check GLW population data against national livestock census figures; adjust feed basket compositions using country-specific FAO STAT data
- Run the baseline inventory — generate the reference-year GHG inventory disaggregated by emission source and production system
- Define mitigation scenarios — parameterize interventions (e.g., 20% improvement in FCR for dairy cattle in mixed systems)
- Compare scenario outputs — evaluate absolute emission reductions (Gg CO₂-eq/year) and emission intensity changes (kg CO₂-eq/kg protein)
- Export spatial outputs — generate gridded emission maps for integration with national GHG reporting systems (UNFCCC inventory format)
Limitations and Complementary Tools
GLEAM is a global-scale screening tool, not a farm-level decision support system. Its spatial resolution and reliance on aggregated feed basket data mean that site-specific accuracy is limited. For farm-level analysis, tools such as the Cool Farm Tool or HolosNMP (for Canadian conditions) provide higher resolution. For watershed-scale nutrient interactions between livestock and crops, SWAT+ (covered separately on SimTool) is the appropriate complement.
GLEAM also does not currently model carbon sequestration in grassland soils, which can partially offset enteric and manure emissions in well-managed grazing systems. The FAO is developing a grassland carbon module for integration in a future GLEAM release.
Access and Further Resources
GLEAM 3.0 is freely available through the FAO's dedicated portal. The model documentation, including full methodological descriptions and validation studies, is published in the FAO Animal Production and Health Guidelines series.
- GLEAM 3.0 Model Portal — FAO
- GLEAM Technical Documentation (FAO, 2023)
- Gridded Livestock of the World (GLW 3)
- IPCC 2019 Refinement — Agriculture, Forestry and Other Land Use (Vol. 4)
- Cool Farm Tool — farm-level GHG and water footprint calculator
For organizations working toward Science Based Targets initiative (SBTi) FLAG (Forest, Land and Agriculture) commitments or national NDC livestock mitigation pathways, GLEAM 3.0 provides the most comprehensive and methodologically transparent global baseline available.