

iThink & STELLA Architect: System Dynamics Modeling for Social Policy and Organizational Learning
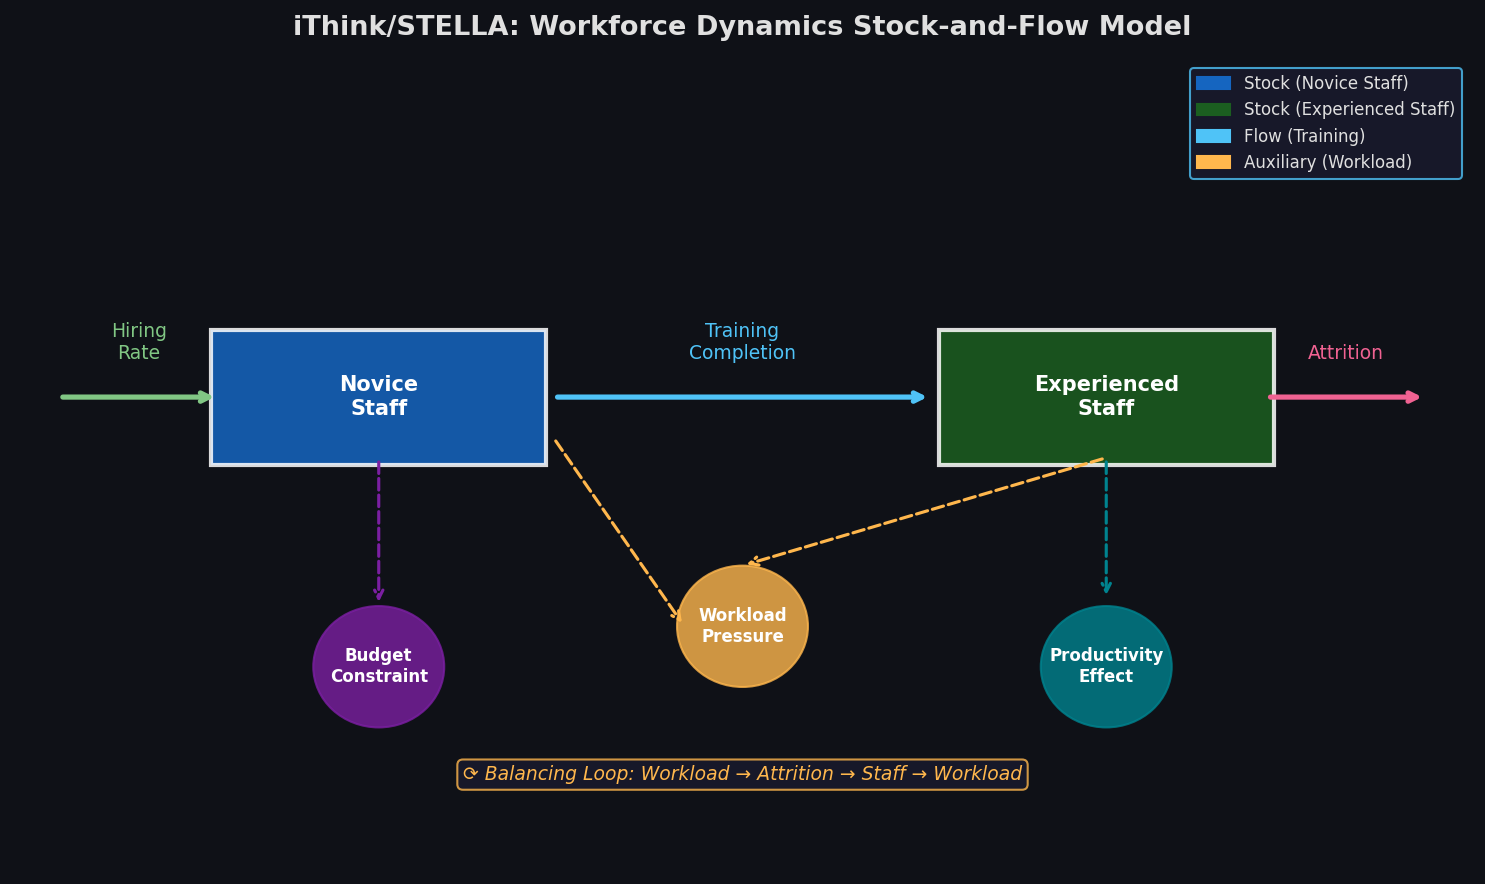
System dynamics has long been the method of choice for understanding how feedback loops, delays, and nonlinear relationships drive the behavior of social systems over time. Among the tools that have shaped this field, iThink (for business and policy analysts) and STELLA Architect (for education and research) from isee systems stand out as the most accessible and feature-rich environments for building stock-and-flow models of complex social phenomena.
What Sets iThink/STELLA Apart
Unlike agent-based platforms that simulate individual actors, iThink and STELLA operate at the aggregate level, representing populations, resources, and information as stocks (accumulations) and flows (rates of change). This makes them particularly well-suited for:
- Policy analysis: Modeling how interventions propagate through social systems with delays
- Organizational learning: Capturing workforce dynamics, knowledge accumulation, and burnout cycles
- Epidemiological modeling: Compartmental SIR/SEIR models with behavioral feedbacks
- Economic and market dynamics: Supply-demand loops, price formation, and adoption curves
The two products share the same modeling engine but target different audiences. STELLA Architect is the full-featured research and education platform, while iThink is optimized for business decision-support with dashboards and scenario management.

Core Modeling Constructs
Stocks, Flows, and Auxiliaries
The fundamental building blocks are:
- Stocks (rectangles): State variables that accumulate over time — population cohorts, inventory levels, trust capital, organizational knowledge
- Flows (double-arrow pipes): Rates that fill or drain stocks — hiring rates, attrition, information decay
- Auxiliaries (circles): Intermediate calculations and policy functions that connect stocks to flows
- Connectors (arrows): Causal links that define the feedback structure
A classic workforce dynamics model might include stocks for Experienced_Staff and Novice_Staff, with flows for Hiring, Training_Completion, and Attrition. The key insight is that Attrition depends on workload pressure, which itself depends on Experienced_Staff — creating a reinforcing loop that can drive organizational collapse under sustained overload.
Graphical Functions (Lookup Tables)
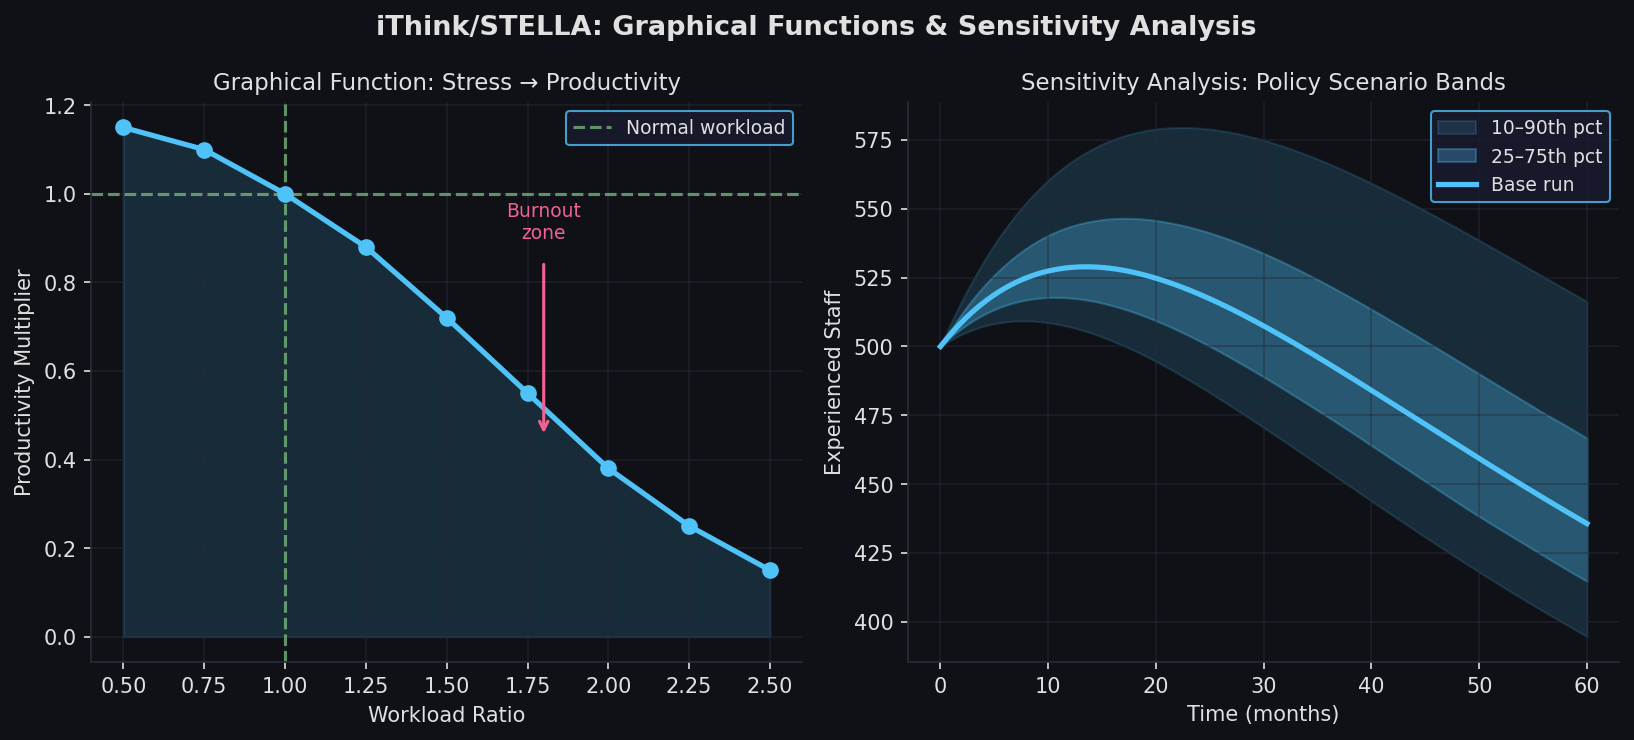
One of iThink/STELLA's most powerful features is the graphical function (also called a table function or lookup), which lets modelers specify arbitrary nonlinear relationships between variables without requiring an algebraic formula. For example:
Effect_of_Stress_on_Productivity = GRAPH(Workload_Ratio)
(0.5, 1.2), (1.0, 1.0), (1.5, 0.75), (2.0, 0.45), (2.5, 0.2)
This captures the empirically observed inverted-U relationship between workload and performance — something that is difficult to express analytically but straightforward to encode as a lookup curve drawn directly in the interface.
Conveyor and Queue Structures
For modeling pipeline delays — a critical feature of social systems — iThink/STELLA provides dedicated conveyor and queue primitives. A conveyor moves material through a fixed transit time (e.g., a 4-year university pipeline), while a queue implements first-in-first-out processing with variable service rates. These structures are essential for modeling:
- Educational pipelines and skill development
- Legislative and bureaucratic processing delays
- Supply chain lead times with social demand signals
Causal Loop Diagrams and Model Documentation
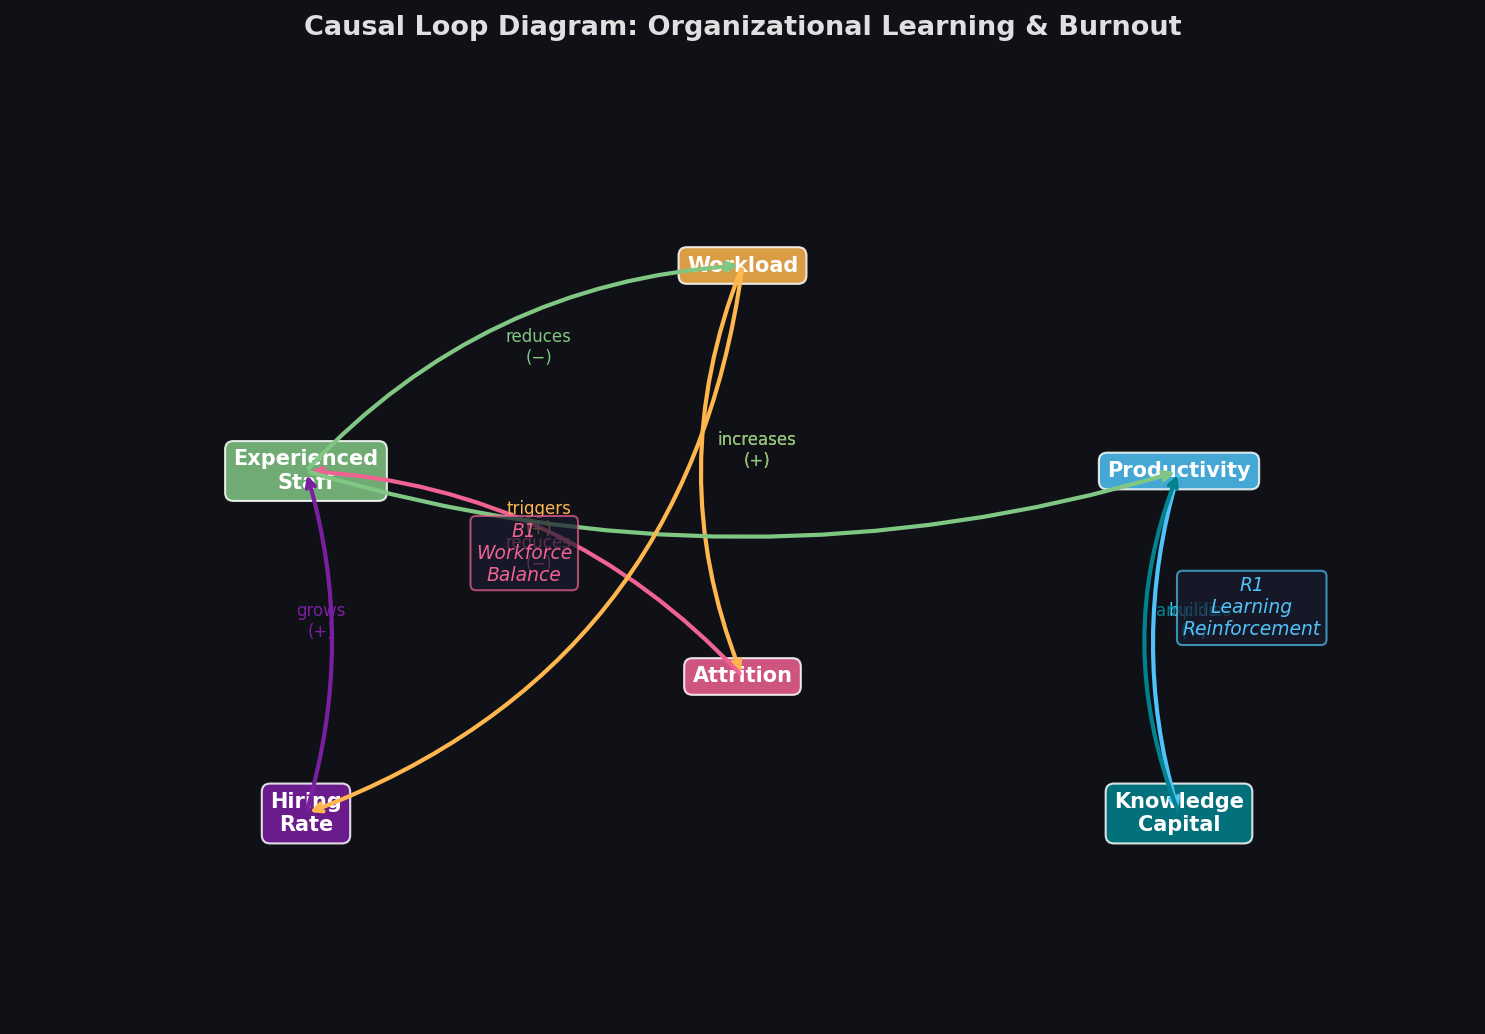
STELLA Architect includes an integrated Causal Loop Diagram (CLD) view that automatically generates a qualitative feedback map from the quantitative model structure. This bidirectional link between CLD and stock-and-flow model is a significant advantage over tools that treat these as separate artifacts.
The CLD view identifies:
- Reinforcing (R) loops: Amplifying dynamics such as viral adoption, panic buying, or knowledge accumulation
- Balancing (B) loops: Goal-seeking behaviors such as price adjustment, workforce hiring to fill gaps, or immune response
Annotating loop polarity and dominance is essential for communicating model insights to non-technical stakeholders — a core use case for both iThink and STELLA.
Sensitivity Analysis and Policy Optimization
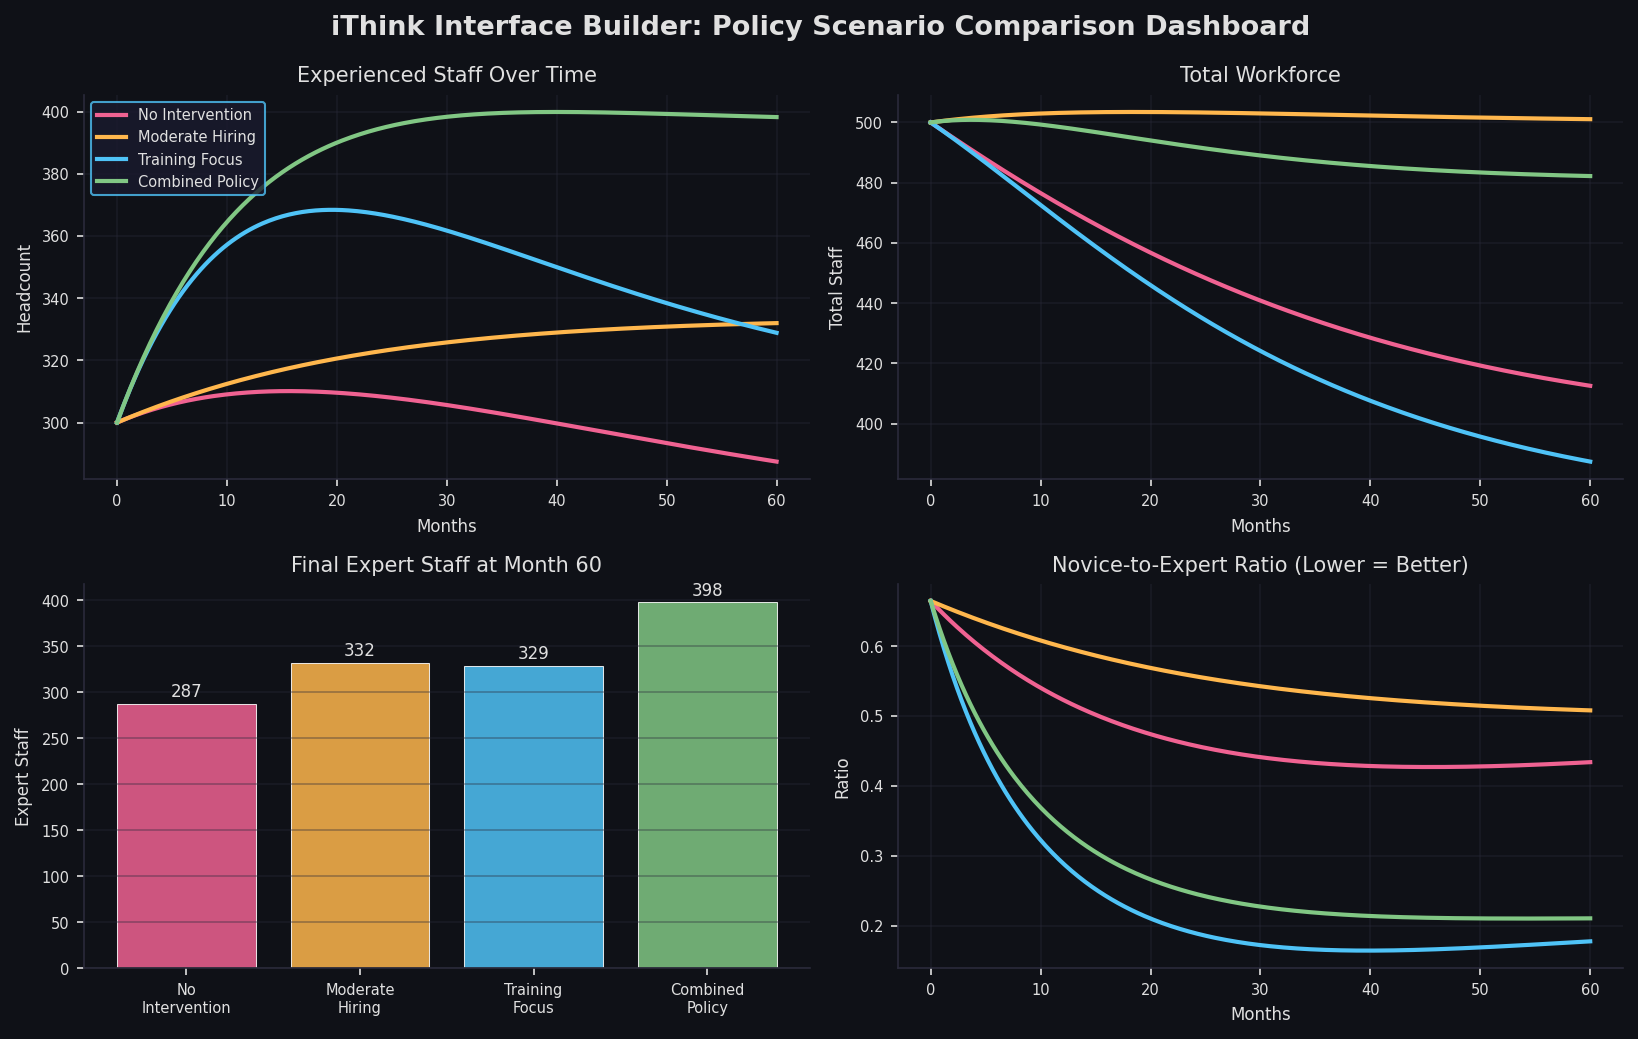
Both tools include built-in sensitivity analysis capabilities that run Monte Carlo simulations over specified parameter ranges. The Sensitivity Testing interface allows modelers to:
- Define uncertain parameters with uniform, normal, or triangular distributions
- Run hundreds of simulation trajectories automatically
- Visualize confidence bands around key output variables
- Identify which parameters most strongly influence outcomes (informal importance ranking)
For policy optimization, iThink includes a Comparative Analysis mode that overlays multiple scenario runs — varying policy levers such as subsidy rates, hiring targets, or intervention timing — on a single chart. This makes it straightforward to communicate trade-offs to decision-makers without requiring them to understand the underlying model equations.
Interface Builder for Stakeholder Engagement
A distinctive feature of iThink/STELLA is the Interface layer — a drag-and-drop dashboard builder that sits on top of the model. Modelers can expose selected sliders, dials, and output graphs to end users who interact with the model without seeing the underlying structure. This is particularly valuable for:
- Policy flight simulators: Letting policymakers explore intervention scenarios interactively
- Educational simulations: Students manipulate parameters and observe emergent behavior
- Executive dashboards: Business leaders run "what-if" scenarios without model expertise
The interface supports input controls (sliders, knobs, switches), output displays (time-series graphs, bar charts, gauges), and explanatory text panels — all configurable without programming.
Integration with Python and External Data
Recent versions of STELLA Architect support STELLA API access, allowing Python scripts to drive model execution programmatically:
import stella_api as stella

model = stella.load("workforce_dynamics.stmx")
model.set_value("Initial_Experienced_Staff", 500)
model.set_value("Annual_Hiring_Budget", 2_000_000)

results = model.run(stop_time=120, dt=0.25)
print(results["Experienced_Staff"].tail(12))
This enables batch scenario analysis, calibration against historical data, and integration with data pipelines — bridging the gap between the visual modeling environment and production analytical workflows.
Practical Considerations
Strengths:
- Rapid model construction with visual feedback structure
- Excellent for communicating dynamics to non-technical audiences
- Built-in sensitivity analysis and scenario comparison
- Strong educational ecosystem (K-12 through graduate level)
Limitations:
- Aggregate representation loses individual heterogeneity (use ABM for that)
- Large models (>500 variables) can become difficult to navigate
- Licensing costs may be prohibitive for individual researchers (academic pricing available)
- Less suited for spatial dynamics without coupling to GIS tools
Getting Started
isee systems offers a 30-day free trial of both iThink and STELLA Architect. The isee Exchange hosts hundreds of community-contributed models spanning public health, economics, ecology, and organizational behavior — an excellent starting point for learning by example.
For formal training, the Road Maps curriculum provides a structured self-study path from basic stock-and-flow concepts through advanced policy analysis techniques.
Further Resources
- isee systems official documentation
- System Dynamics Society — peer-reviewed journal and annual conference
- Sterman, J.D. (2000). Business Dynamics: Systems Thinking and Modeling for a Complex World. McGraw-Hill — the definitive textbook
- isee Exchange model library — community models and templates
- STELLA Online — browser-based version for classroom use