
RViz: Real-Time 3D Visualization and Debugging for ROS-Based Robotics
RViz (ROS Visualization) stands as the primary 3D visualization tool in the Robot Operating System (ROS) ecosystem, providing robotics engineers and researchers with powerful real-time visualization capabilities for debugging, monitoring, and analyzing robotic systems. Unlike general-purpose simulation environments, RViz specializes in displaying live sensor data, robot states, and planning outputs, making it an indispensable tool for development and troubleshooting.

Core Visualization Capabilities
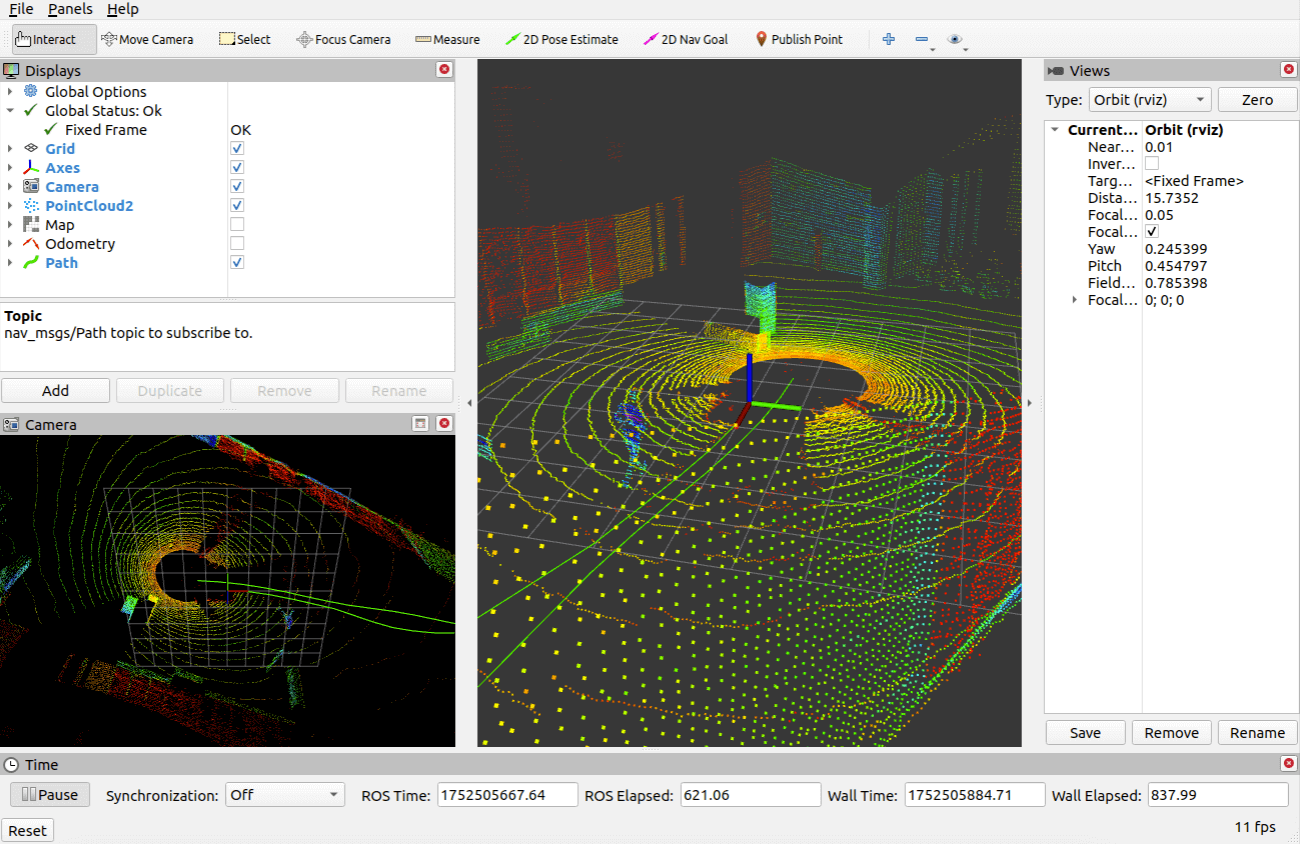
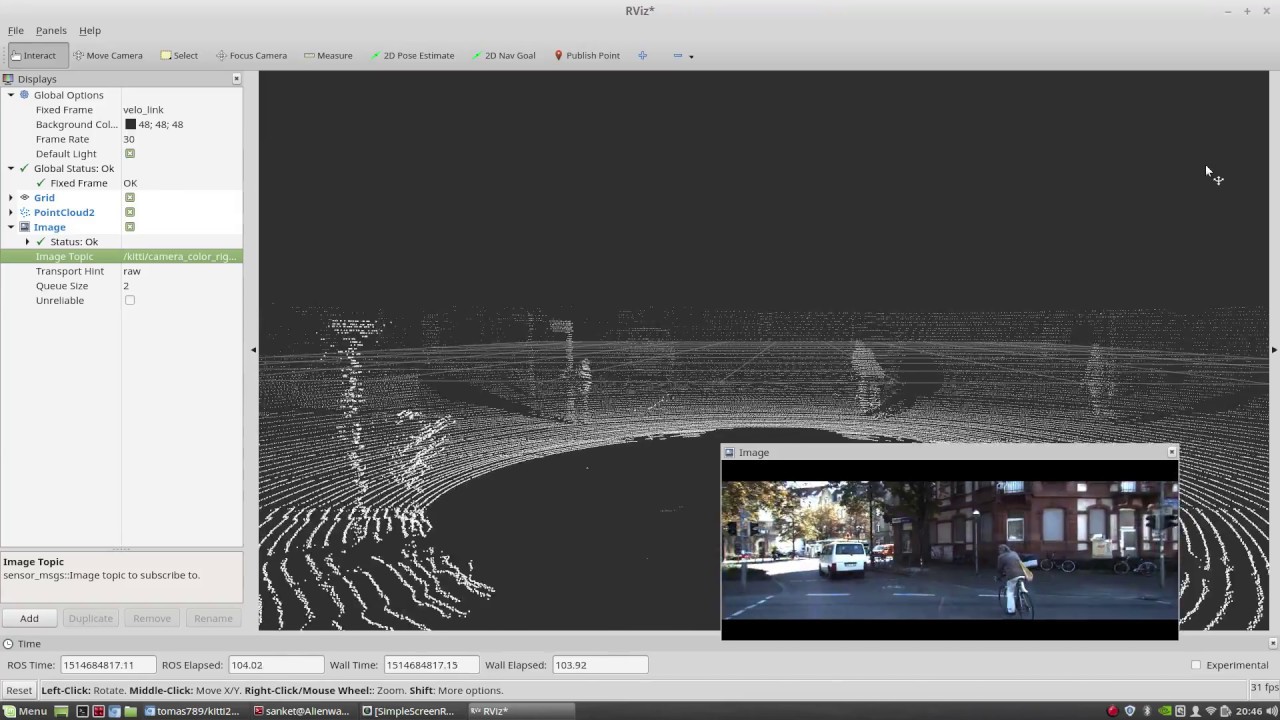
RViz operates as a plugin-based visualization framework that subscribes to ROS topics and transforms raw data streams into intuitive 3D representations. The tool excels at rendering diverse data types including point clouds from LiDAR sensors, camera images, laser scans, occupancy grids, and robot model states through URDF (Unified Robot Description Format) files. Engineers can simultaneously visualize multiple data sources, enabling comprehensive system analysis in a single interface.

The marker system in RViz provides programmatic control over visualization elements, allowing developers to publish custom geometric shapes, text annotations, and trajectory paths directly from their code. This feature proves particularly valuable when debugging path planning algorithms or visualizing intermediate computational results that don't correspond to physical sensor data.
Interactive Tools for Robot Control
Beyond passive visualization, RViz offers interactive markers that enable direct manipulation of robot goals and poses through the 3D interface. Users can set navigation goals by clicking on the map, adjust joint positions through interactive controls, or define regions of interest for perception algorithms. This interactivity bridges the gap between visualization and control, streamlining the development workflow.
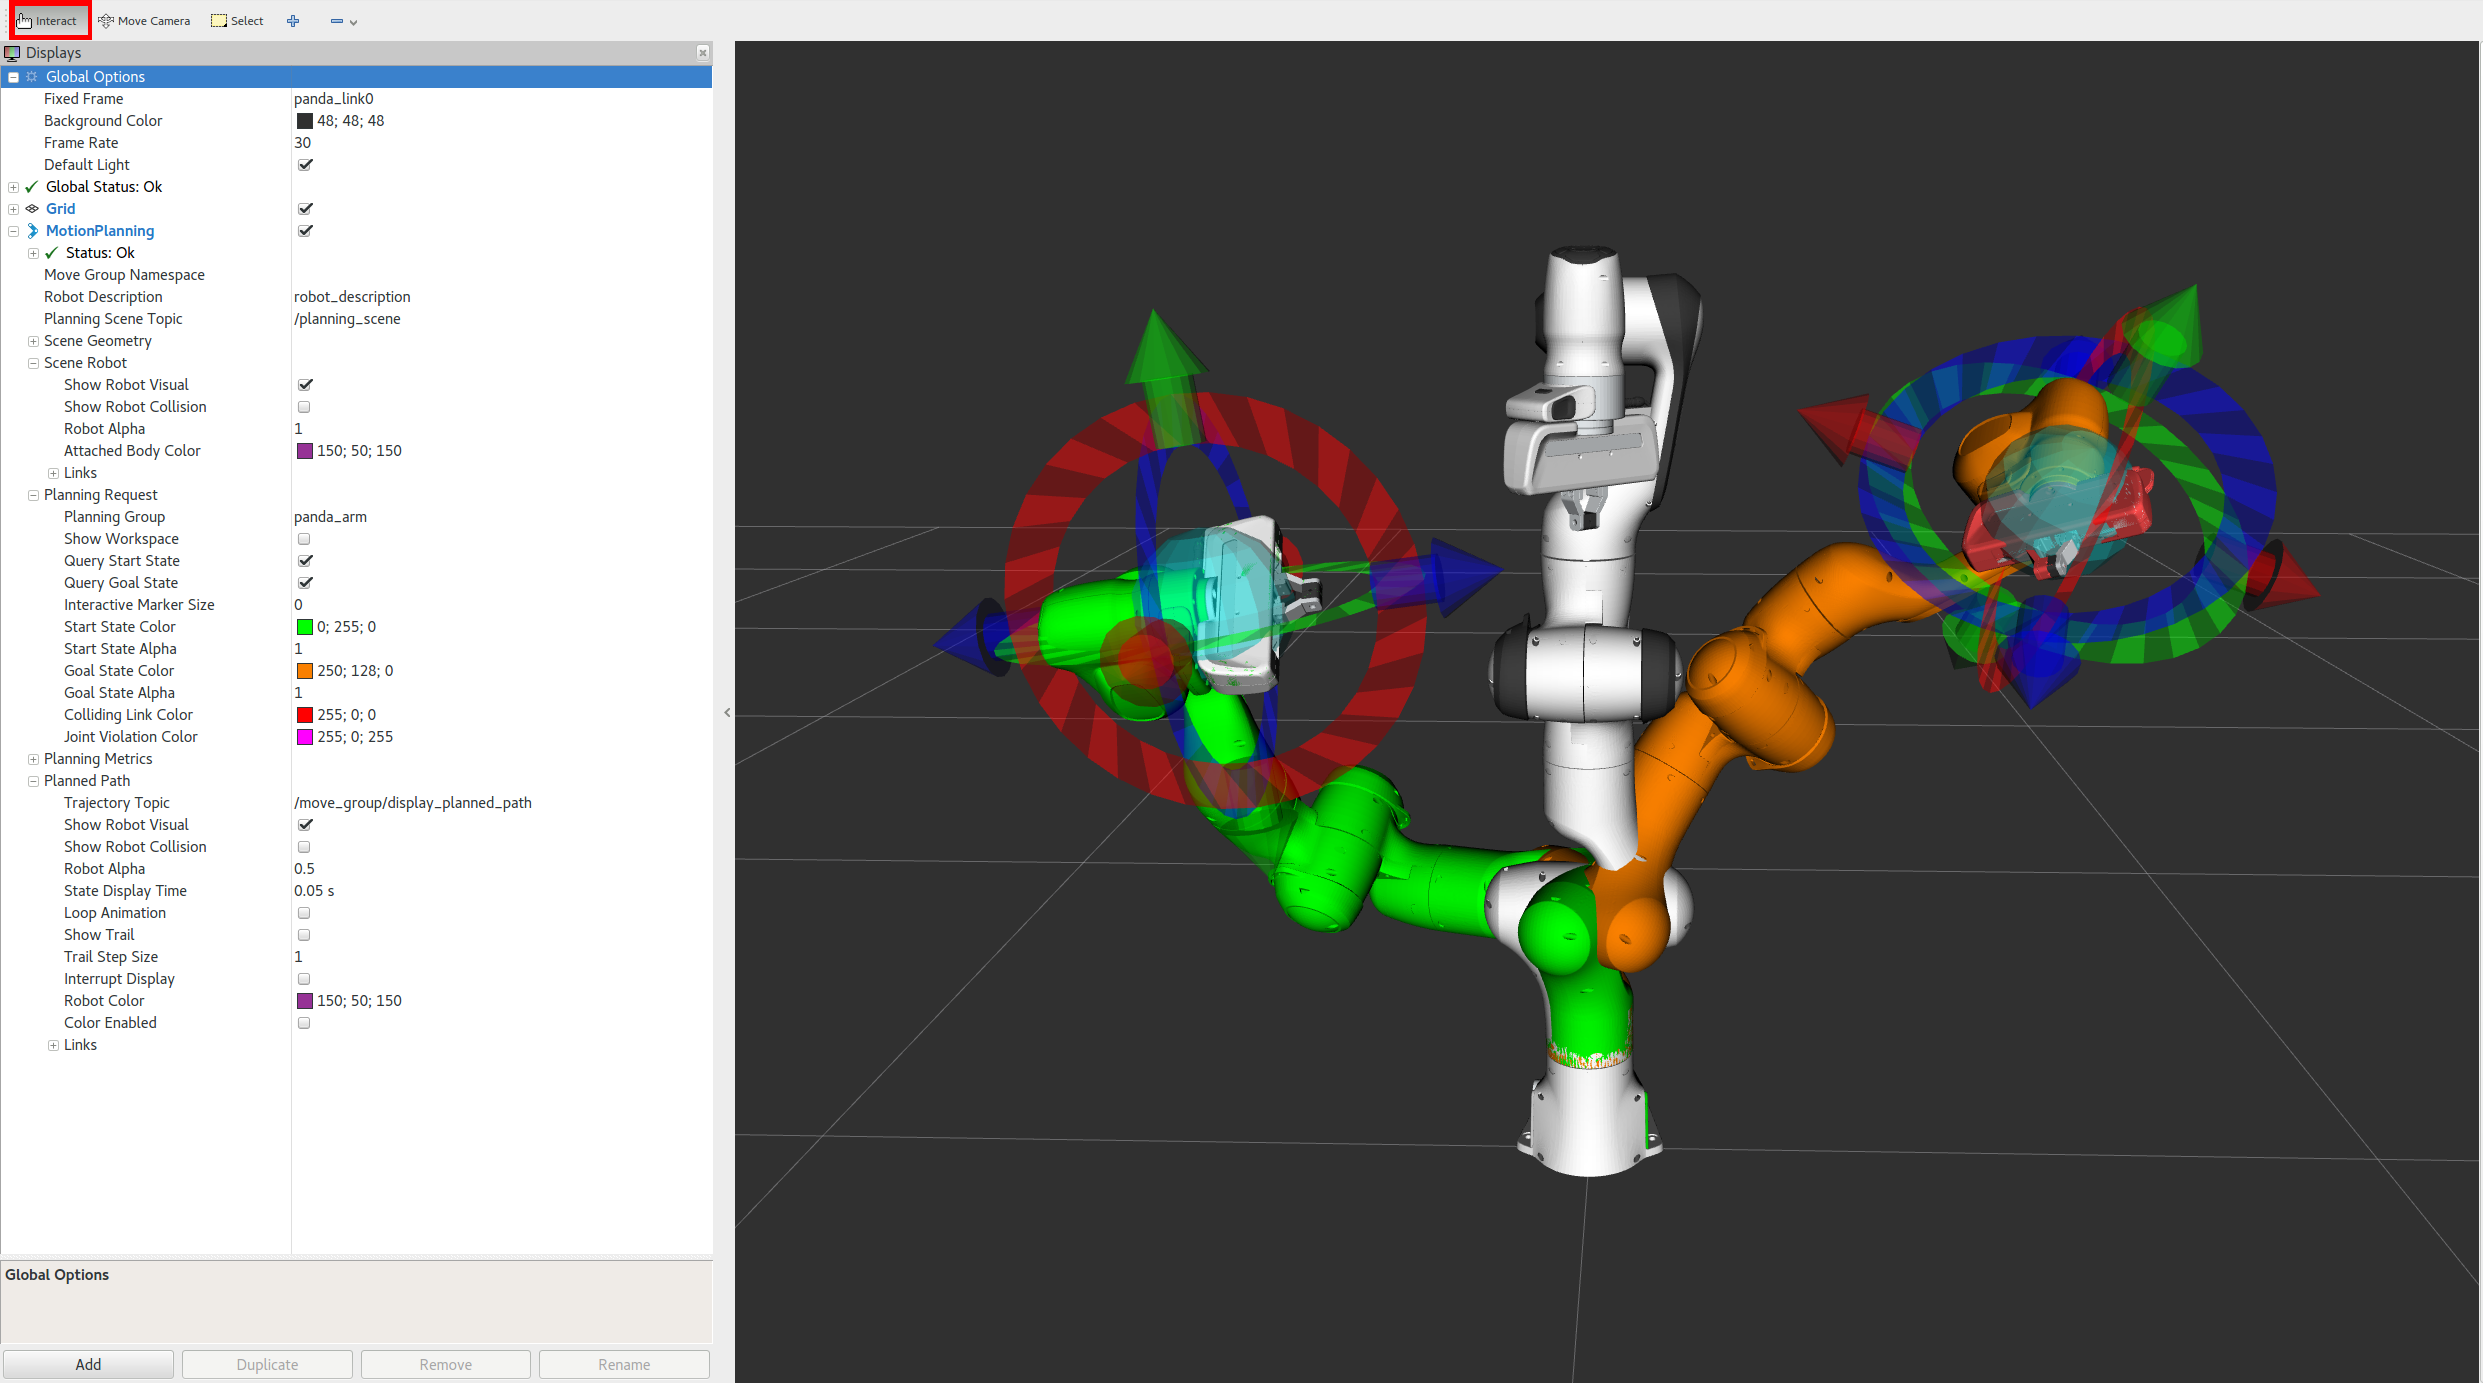
The tool's integration with MoveIt motion planning framework deserves special attention. RViz serves as MoveIt's primary interface, displaying planned trajectories, collision objects, and workspace constraints. Engineers can interactively modify goal poses, trigger planning requests, and visualize the resulting motion plans before execution—a critical capability for validating complex manipulation tasks.
Configuration and Display Management
RViz's display panel allows users to organize visualization elements hierarchically, with each display type offering specific configuration parameters. For instance, point cloud displays support various color schemes based on intensity, height, or custom channels, while TF (transform) displays can show coordinate frame relationships with adjustable scale and visibility settings.
Configuration files save entire visualization setups, enabling teams to share standardized views for specific robots or tasks. This feature ensures consistency across development teams and facilitates rapid context switching between different debugging scenarios. The ability to programmatically load configurations also supports automated testing workflows.
Performance Optimization Strategies
When working with high-bandwidth sensors like 3D LiDAR or dense point clouds, RViz performance becomes critical. The tool provides several optimization mechanisms including point cloud downsampling, selective topic subscription, and adjustable update rates. Understanding these parameters helps maintain responsive visualization even with computationally intensive sensor processing.
The fixed frame selection significantly impacts performance and correctness. Choosing an appropriate fixed frame—typically the robot's base or a world frame—ensures stable visualization and prevents unnecessary transform computations. For mobile robots, switching between map-relative and robot-relative views helps diagnose localization issues.
Integration with ROS 2 and Modern Workflows
RViz2, the ROS 2 implementation, maintains API compatibility while leveraging the improved middleware architecture. The transition brings enhanced performance through better memory management and supports the Quality of Service (QoS) policies that enable more reliable visualization in distributed systems. Legacy RViz configurations largely transfer to RViz2, easing migration for existing projects.
Modern robotics workflows increasingly incorporate RViz into continuous integration pipelines through headless rendering capabilities. Automated tests can generate visualization snapshots for regression testing or documentation purposes, extending RViz's utility beyond interactive development sessions.
Best Practices for Effective Debugging
Experienced ROS developers employ several RViz techniques to accelerate debugging. Creating multiple saved configurations for different debugging contexts—sensor validation, navigation testing, manipulation planning—allows quick switching between relevant views. Using the time display to monitor message timestamps helps identify synchronization issues or stale data.
The camera view controls enable precise inspection of specific regions or following the robot's perspective during navigation. Combining this with selective display toggling helps isolate problematic components in complex systems. For multi-robot scenarios, namespace-aware configurations allow simultaneous visualization of multiple robots without topic conflicts.
Conclusion
RViz represents more than a visualization tool—it functions as a comprehensive debugging environment that accelerates robotics development by making abstract data streams tangible and interactive. Its tight integration with the ROS ecosystem, combined with extensibility through custom plugins, ensures relevance across diverse robotics applications from academic research to industrial automation. Mastering RViz's capabilities significantly enhances productivity in ROS-based robotics development.