

Percepio Tracealyzer: RTOS Trace Visualization and Runtime Analysis for Embedded Systems
Modern embedded systems running real-time operating systems (RTOS) present a unique debugging challenge: the very act of observing the system can alter its timing behavior, and traditional printf-style logging is far too slow to capture microsecond-level scheduling events. Percepio Tracealyzer addresses this problem directly, providing a non-intrusive trace recording and visualization platform that gives engineers a complete, time-accurate picture of RTOS runtime behavior — from task scheduling and interrupt latency to queue operations and memory allocation patterns.
What Is Tracealyzer?
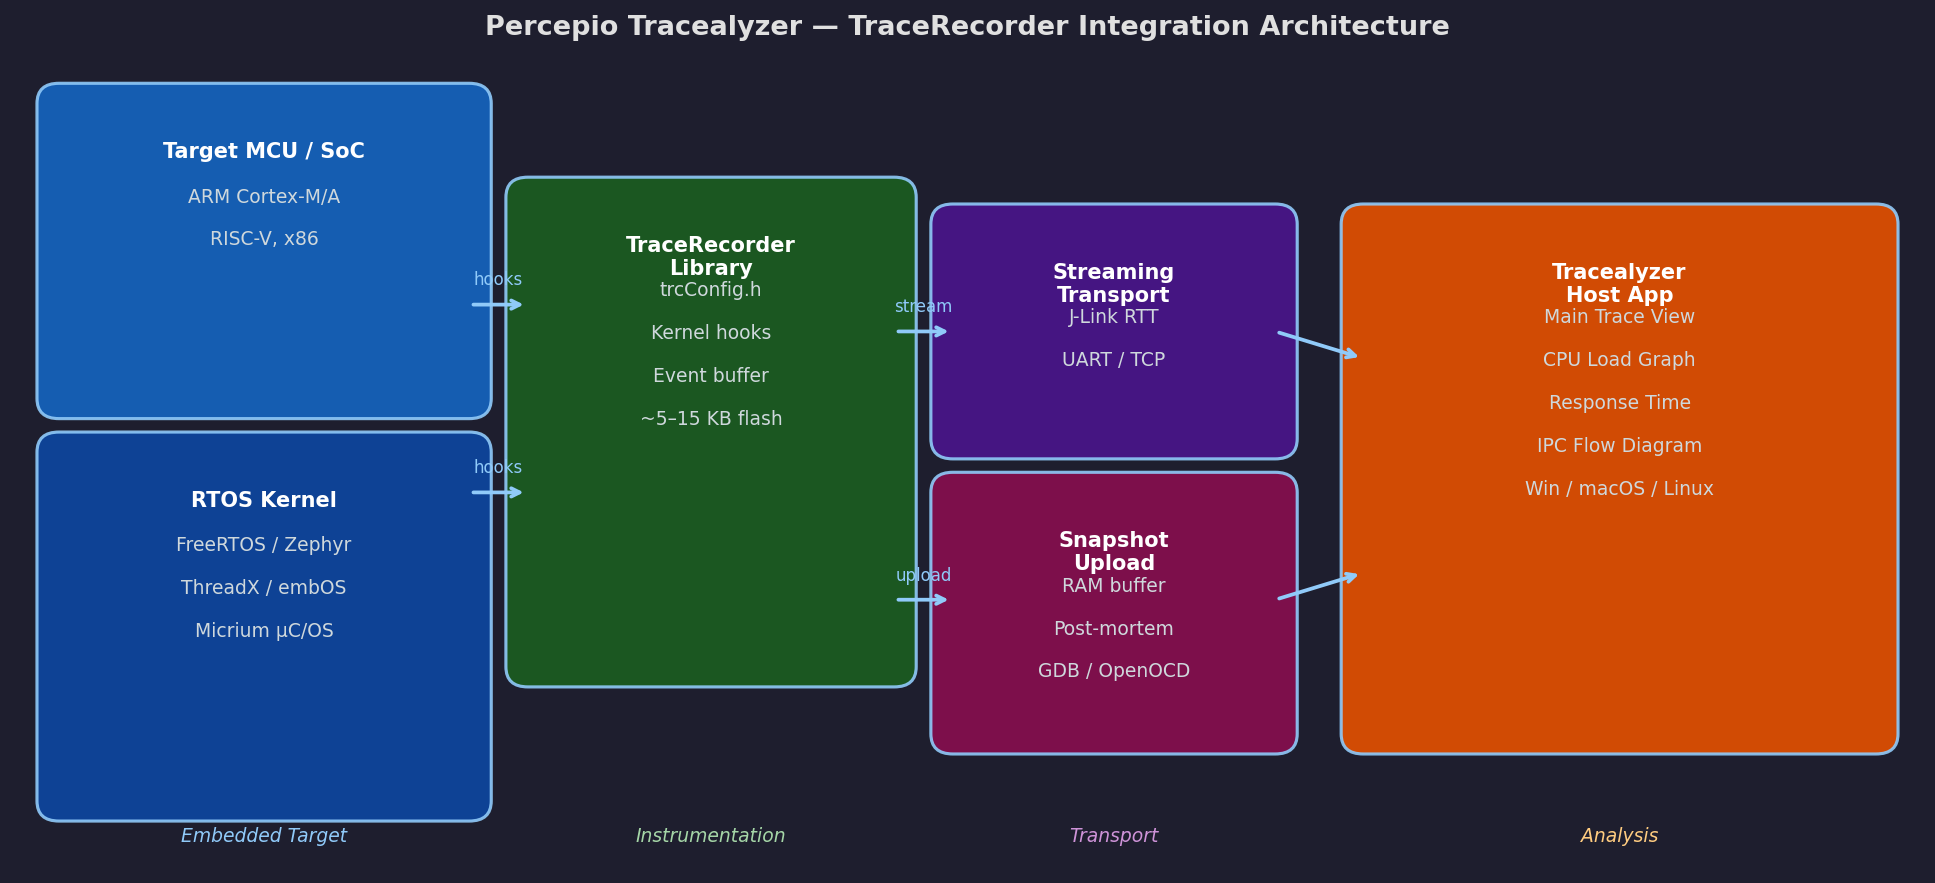
Tracealyzer is a software-based trace analysis tool that works in conjunction with Percepio's TraceRecorder library, a lightweight C library integrated directly into the RTOS kernel. It supports all major RTOS platforms including FreeRTOS, Zephyr, ThreadX (Azure RTOS), Micrium µC/OS, and embOS, as well as Linux via the LTTng framework. The tool captures kernel-level events — task switches, semaphore gives/takes, queue sends/receives, timer callbacks, and user-defined events — with timestamps at the hardware timer resolution, typically in the range of 10–100 nanoseconds.
Trace data can be streamed in real time over a J-Link debug probe, UART, or TCP/IP, or captured in a snapshot buffer in RAM and uploaded post-mortem. This flexibility makes Tracealyzer equally useful during active development on a bench setup and in field-deployed systems where a debug probe may not be available.

Key Analysis Views
Main Trace View
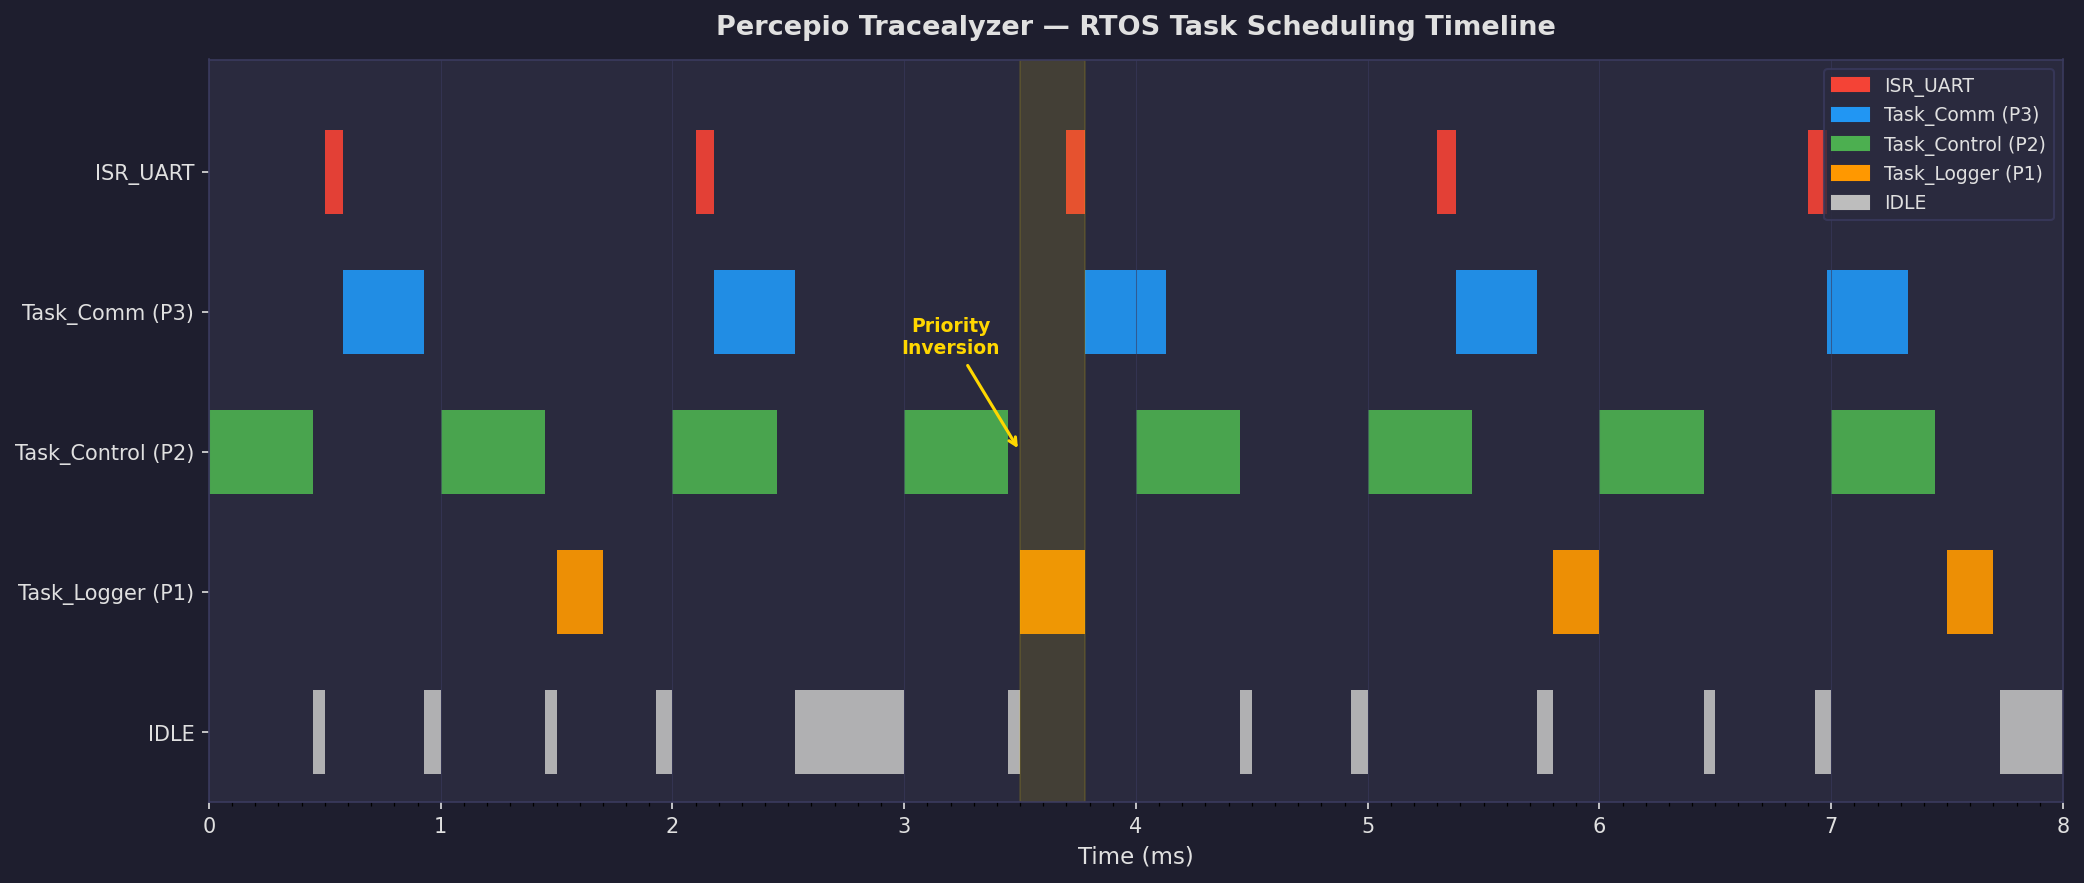
The primary visualization is a horizontal timeline showing every task and ISR as a colored lane. Each scheduling event — preemption, blocking, ready, running — is rendered as a pixel-accurate bar. Engineers can zoom from a full 10-second trace down to individual microsecond-level context switches, immediately identifying unexpected preemptions or priority inversions that would be invisible in a logic analyzer trace.
CPU Load Graph
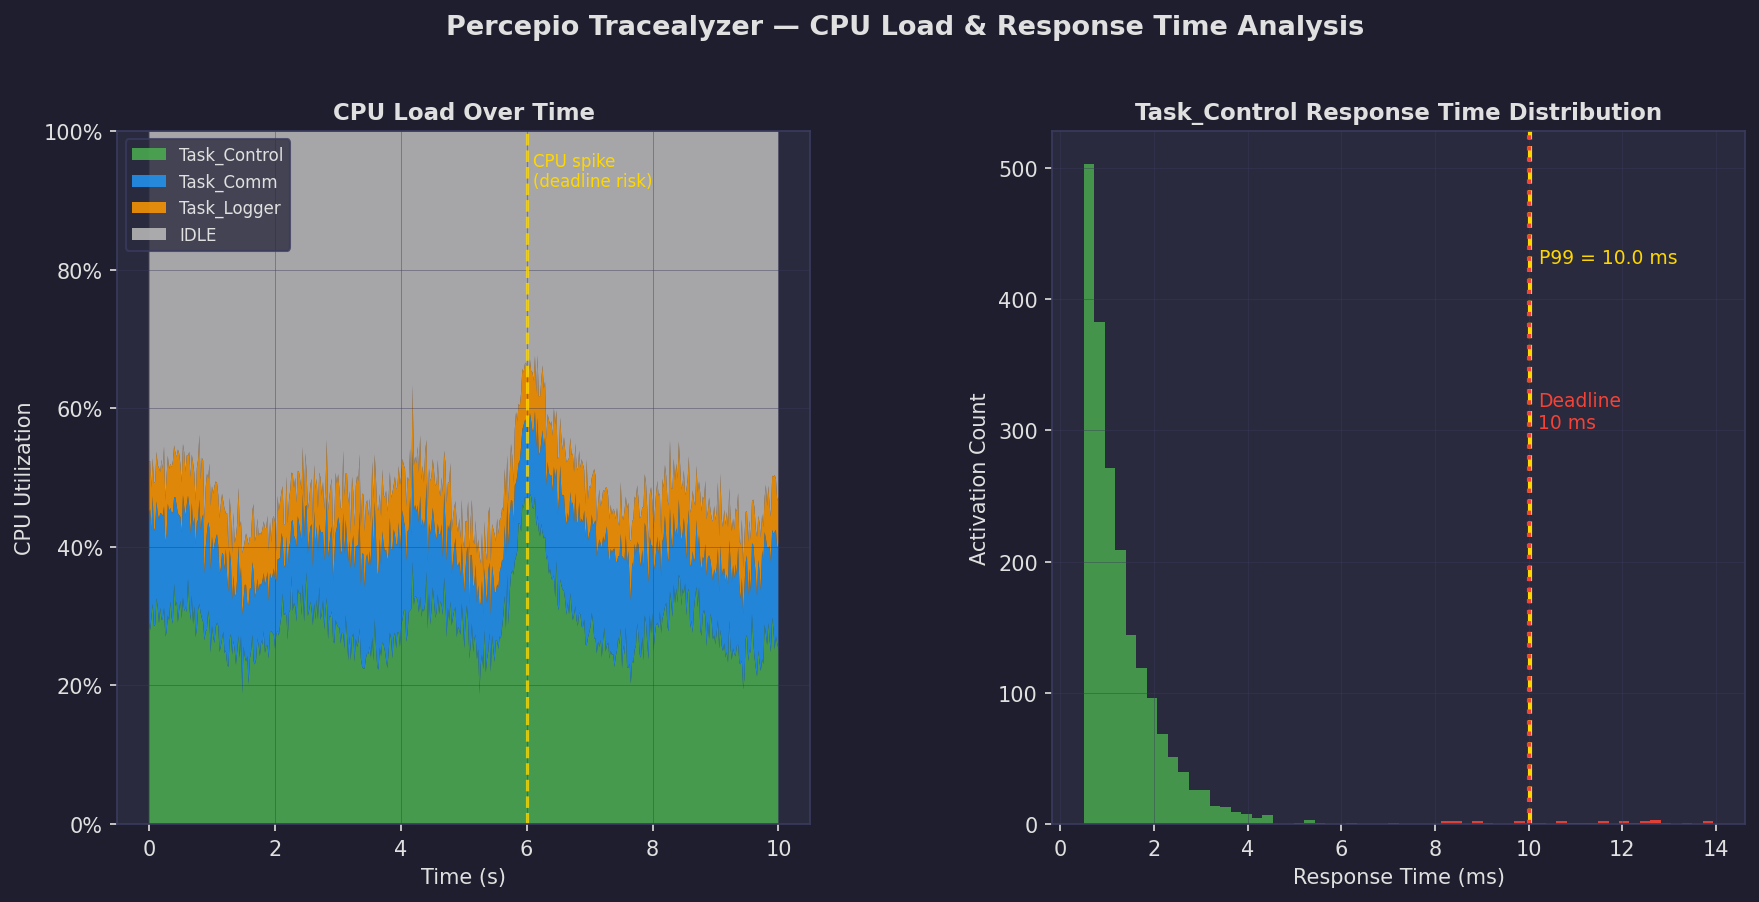
The CPU Load view aggregates scheduling data into a rolling window (configurable from 1 ms to 1 s) and plots per-task CPU utilization over time. This is invaluable for identifying tasks that occasionally spike beyond their expected budget — a common root cause of missed deadlines in soft real-time systems. The view also highlights idle time, giving a direct measure of headroom.
Response Time Analysis
For each task, Tracealyzer computes the response time — the elapsed time from the moment a task becomes ready (e.g., after a semaphore give) to the moment it completes its work and blocks again. The Response Time view plots the distribution of these values across all activations, flagging maximum and 99th-percentile outliers. This is the primary tool for verifying that a task meets its deadline across thousands of activations, not just in the best case.
Communication Flow Diagram
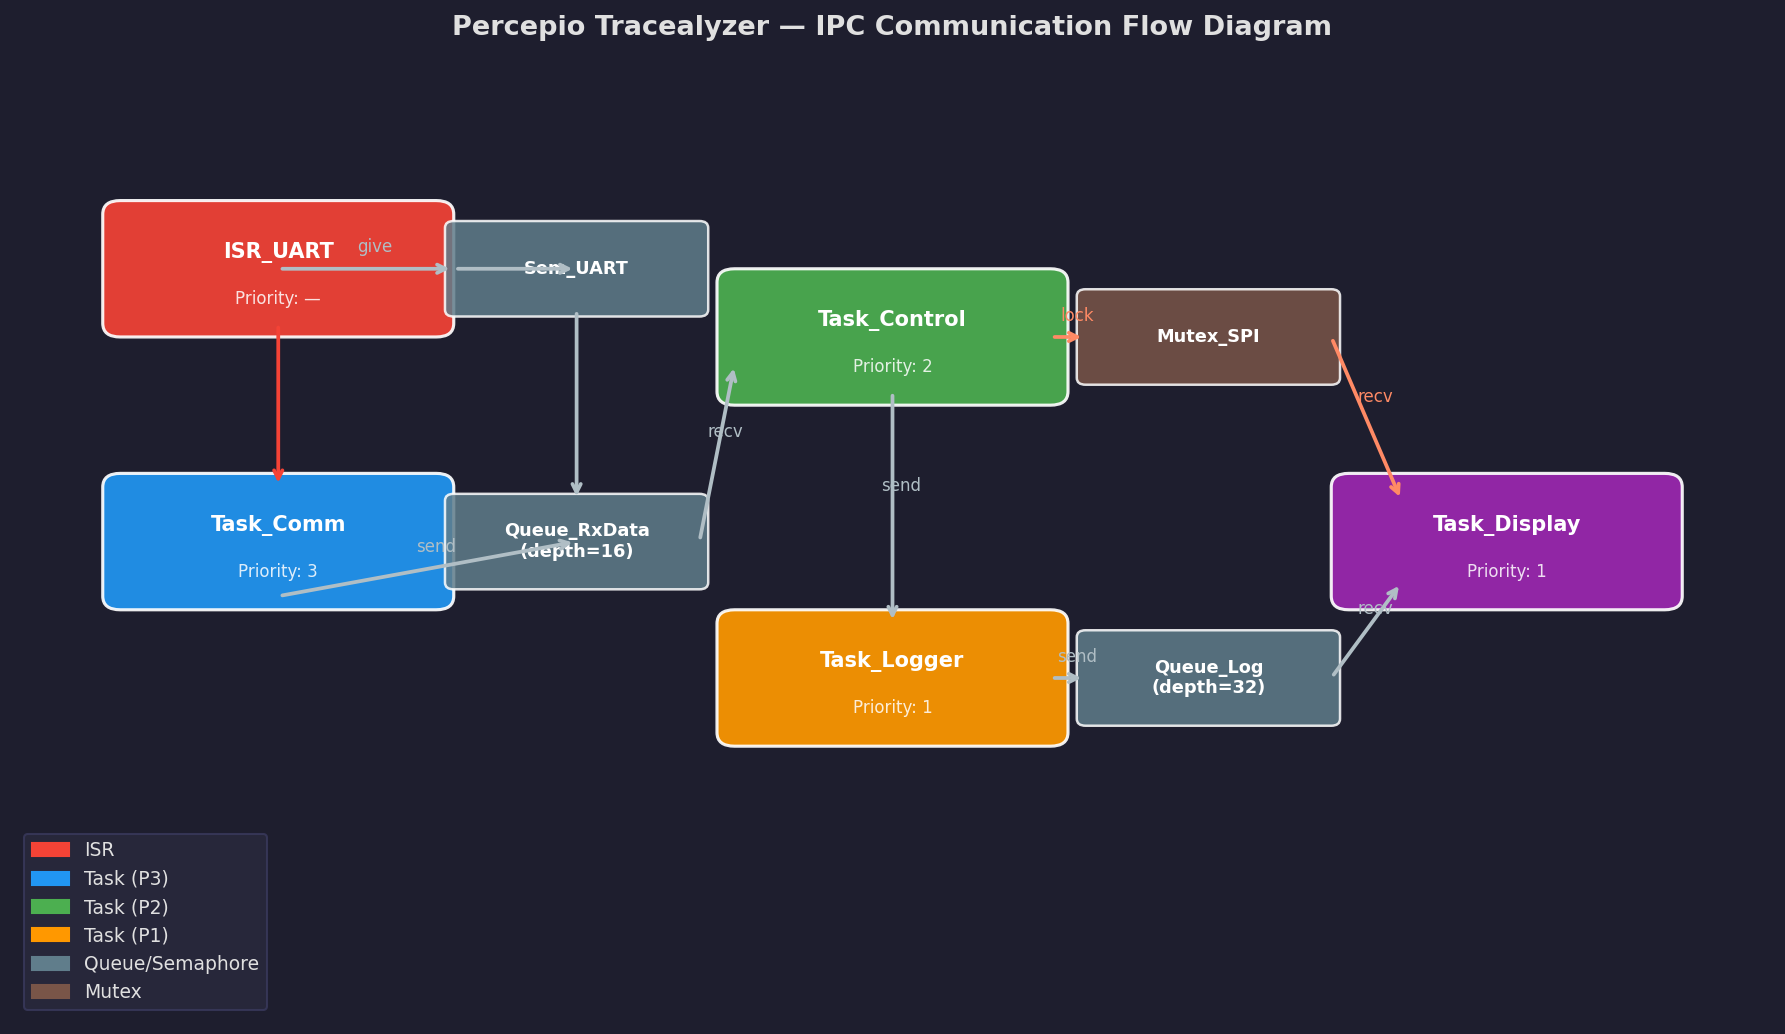
The Communication Flow view renders a directed graph of all IPC interactions: which tasks send to which queues, which ISRs post to which semaphores, and which tasks consume from which event groups. This structural view is particularly useful when onboarding a new codebase or auditing a system for potential deadlock conditions — circular dependencies in the IPC graph are immediately visible.
Integrating TraceRecorder into a FreeRTOS Project
Integration requires three steps:
-
Add the TraceRecorder sources to the project build. The library is available on GitHub under a permissive license and adds approximately 5–15 KB of flash depending on the feature set enabled.
-
Configure
trcConfig.hto select the recording mode (snapshot vs. streaming), set the event buffer size, and enable the RTOS port. For FreeRTOS, the port hooks intotraceTASK_SWITCHED_IN,traceTASK_SWITCHED_OUT, and the queue/semaphore trace macros defined inFreeRTOS.h. -
Initialize the recorder before the scheduler starts:
vTraceEnable(TRC_START);  // snapshot mode
// or
vTraceEnable(TRC_START_AWAIT_HOST);  // streaming mode, waits for host connection
For streaming mode, a J-Link RTT channel is the most common transport, requiring no additional hardware beyond the debug probe already used for programming. Throughput is typically 1–4 MB/s, sufficient to stream all events from a system with 20–30 tasks without dropping events.
Diagnosing Priority Inversion with Tracealyzer
Priority inversion — where a high-priority task is blocked waiting for a resource held by a low-priority task — is one of the most insidious bugs in RTOS-based systems. Tracealyzer makes it immediately visible: the high-priority task lane shows a "blocked" state while a lower-priority task is in the "running" state, and the tool automatically annotates the blocking relationship with an arrow connecting the two lanes.
In systems using FreeRTOS mutexes with priority inheritance, Tracealyzer also visualizes the temporary priority boost applied to the low-priority task, confirming that the inheritance mechanism is functioning correctly and measuring the actual duration of the inversion.
Interrupt Latency Measurement
Tracealyzer records ISR entry and exit events with the same hardware timestamp resolution as task events. The ISR Latency view plots the time from the hardware interrupt assertion (captured via a user event placed at the start of the ISR handler) to the first instruction of the handler, across all occurrences. This measurement is critical for systems with hard real-time interrupt requirements, such as motor control loops or communication protocol handlers.
For more precise latency measurement, Tracealyzer supports user events — lightweight log points inserted in application code using the xTracePrintF() API — that appear as labeled markers on the timeline and can be used to measure arbitrary intervals between any two points in the code.
Practical Workflow for Deadline Verification
A systematic workflow for verifying task deadlines using Tracealyzer:
- Instrument the system with TraceRecorder in streaming mode and connect via J-Link.
- Run the system under representative load — inject the worst-case input stimulus, enable all background tasks, and run for at least 60 seconds to capture rare events.
- Export the response time statistics for each critical task (File → Export → Response Times CSV).
- Compare against WCET budgets — flag any task where the measured maximum response time exceeds 80% of the deadline, leaving margin for production variability.
- Drill into outliers — double-click any response time spike in the distribution view to jump directly to that activation in the main trace, revealing the exact preemption sequence that caused the delay.
Licensing and Platform Support
Tracealyzer is available in three tiers: a free Community Edition supporting FreeRTOS with a 1,000-event snapshot buffer, a Professional Edition with unlimited streaming and all RTOS ports, and an Enterprise Edition adding automated regression testing via the command-line trcanalyze tool. The host application runs on Windows, macOS, and Linux.
For teams targeting IEC 61508 or ISO 26262 functional safety standards, Percepio offers a Safety Edition with a qualified TraceRecorder library and documentation package suitable for inclusion in a safety case.