
Synopsys Verdi: Automated Debug and Coverage Analysis for SoC Verification
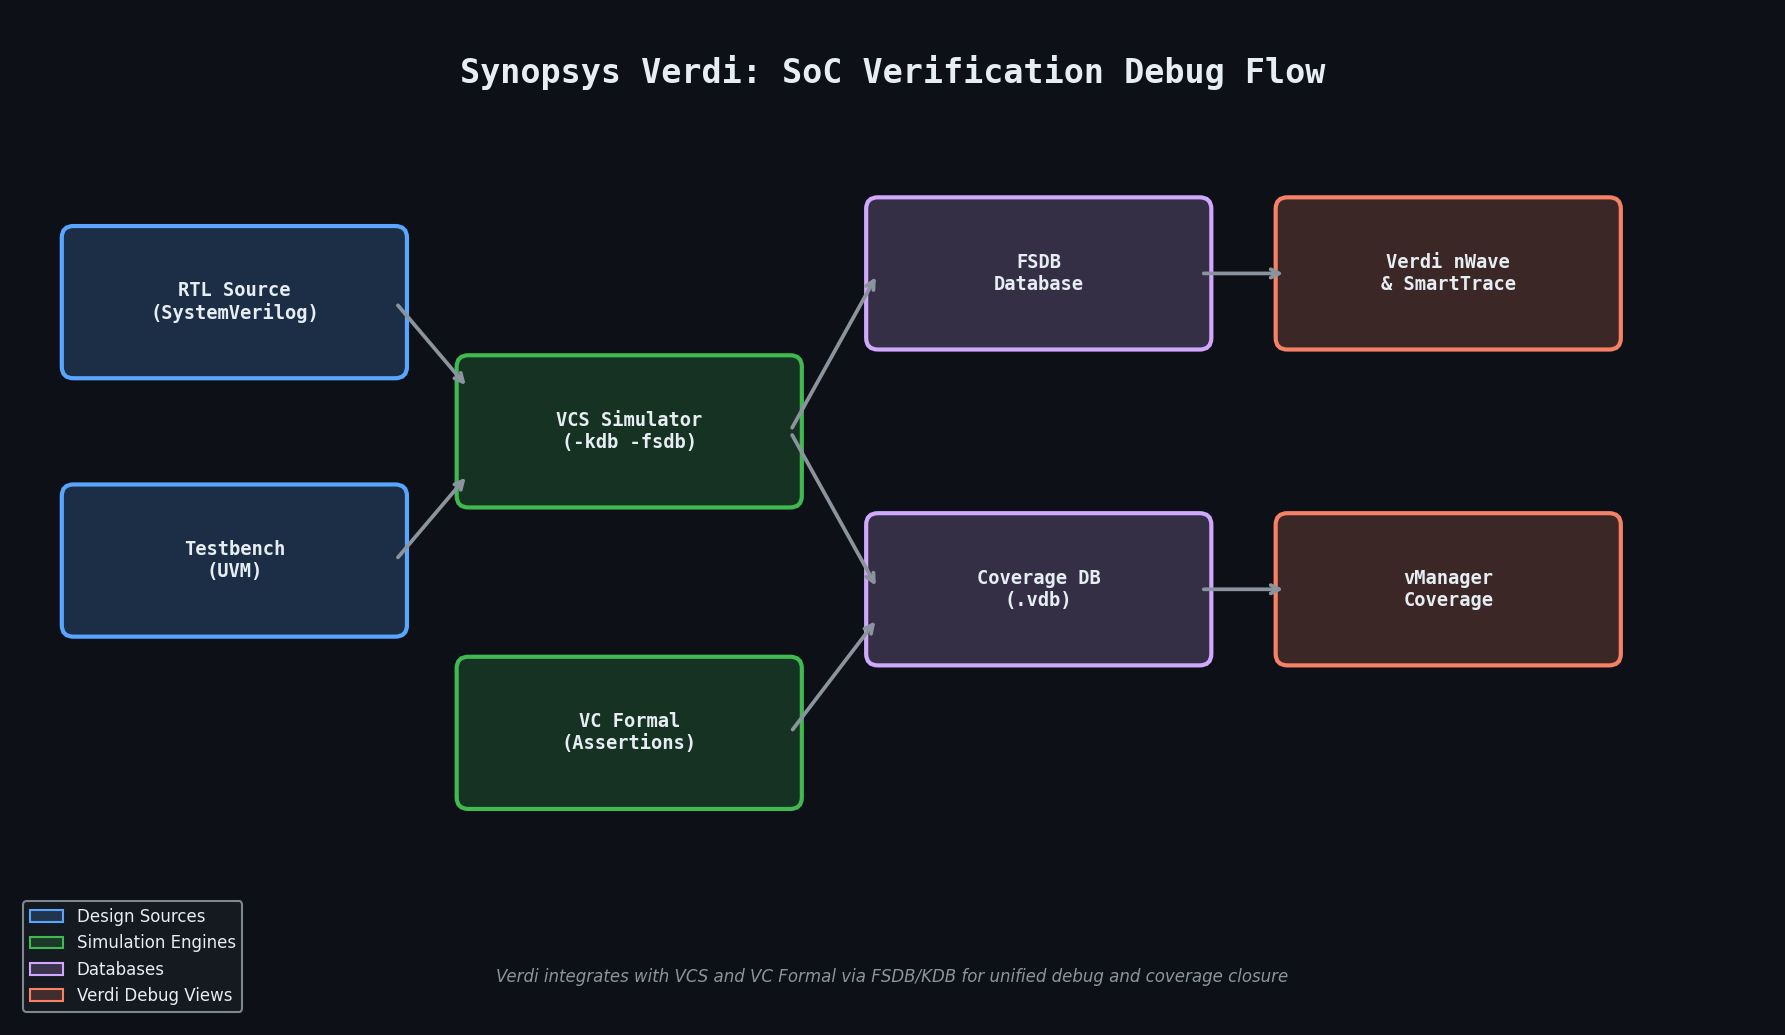
Modern system-on-chip (SoC) designs routinely exceed one billion gates, and the verification effort required to achieve sign-off confidence has grown proportionally. Simulation runtimes measured in days, waveform databases that span terabytes, and coverage closure campaigns that span months are now the norm rather than the exception. Synopsys Verdi addresses this challenge head-on as a purpose-built debug and coverage analysis platform that integrates tightly with VCS, VC Formal, and third-party simulators to give verification engineers a unified, intelligent view of simulation results.
What Verdi Does Differently
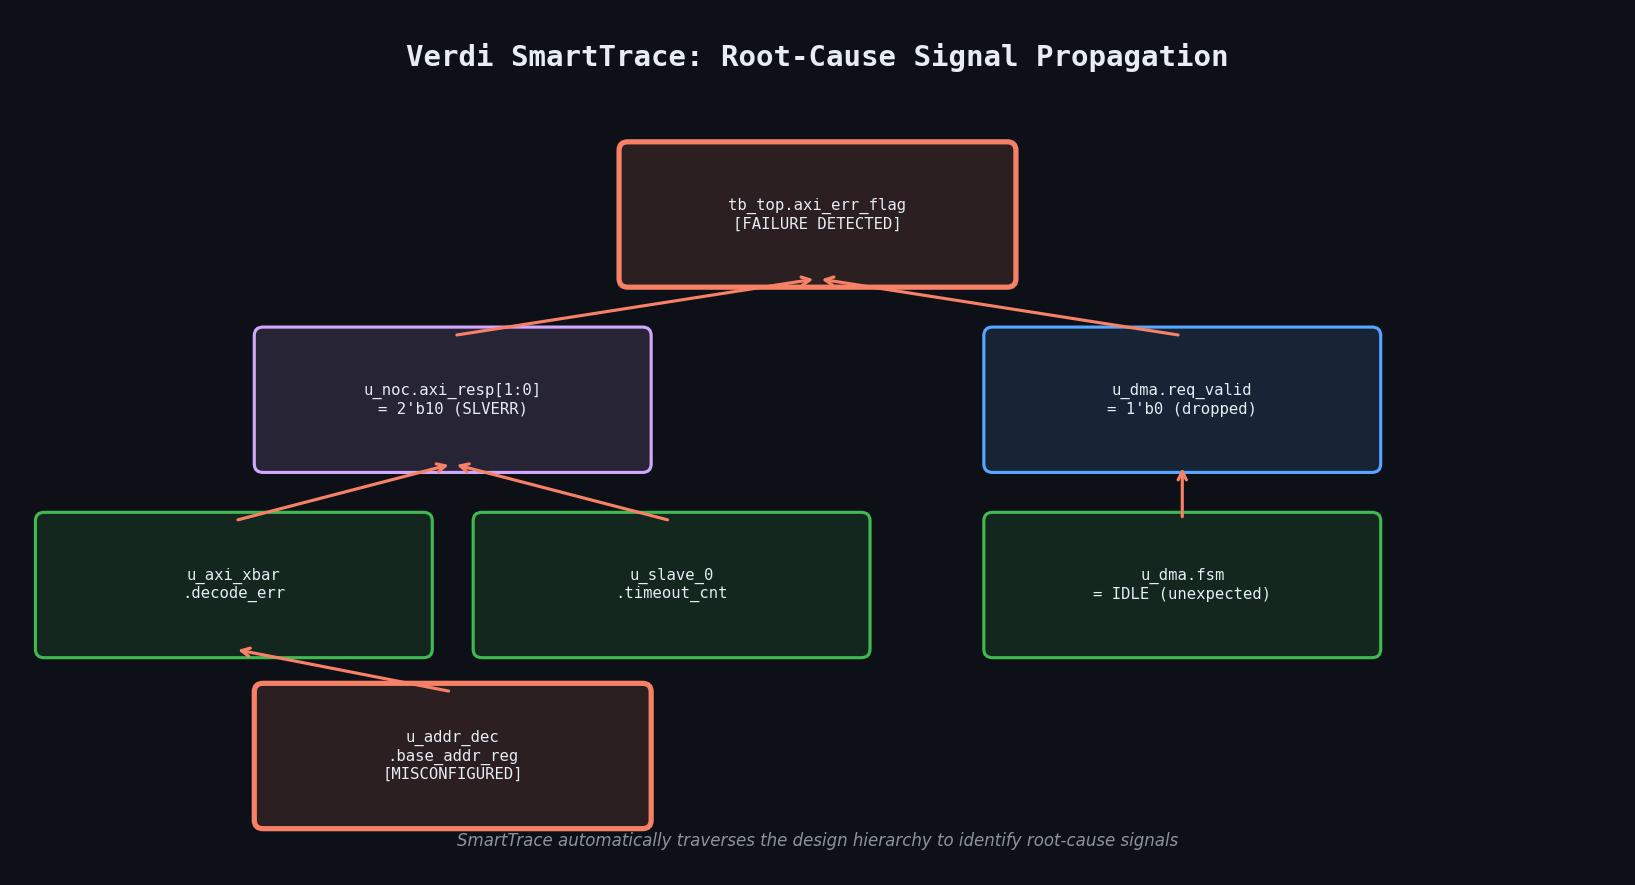
Traditional waveform viewers — GTKWave, ModelSim's wave window, or even Cadence SimVision — are passive: they display what the simulator recorded and leave the engineer to manually trace signal relationships. Verdi takes an active approach through its SmartTrace technology, which automatically propagates signal activity backward through the design hierarchy to identify the root cause of a failure. Rather than manually expanding dozens of hierarchical levels to find where a bus corruption originated, SmartTrace presents a ranked list of candidate sources with a single click.
Verdi's nWave waveform viewer extends this with protocol-aware decoding. Engineers can load standard bus protocol plug-ins — AXI4, CHI, PCIe TLP, AMBA APB/AHB — and Verdi will decode raw signal transitions into human-readable transaction records displayed as colored transaction bars above the raw waveforms. This dramatically reduces the cognitive load of debugging complex interconnect failures in NoC-based SoC designs.
Coverage Database Management with vManager
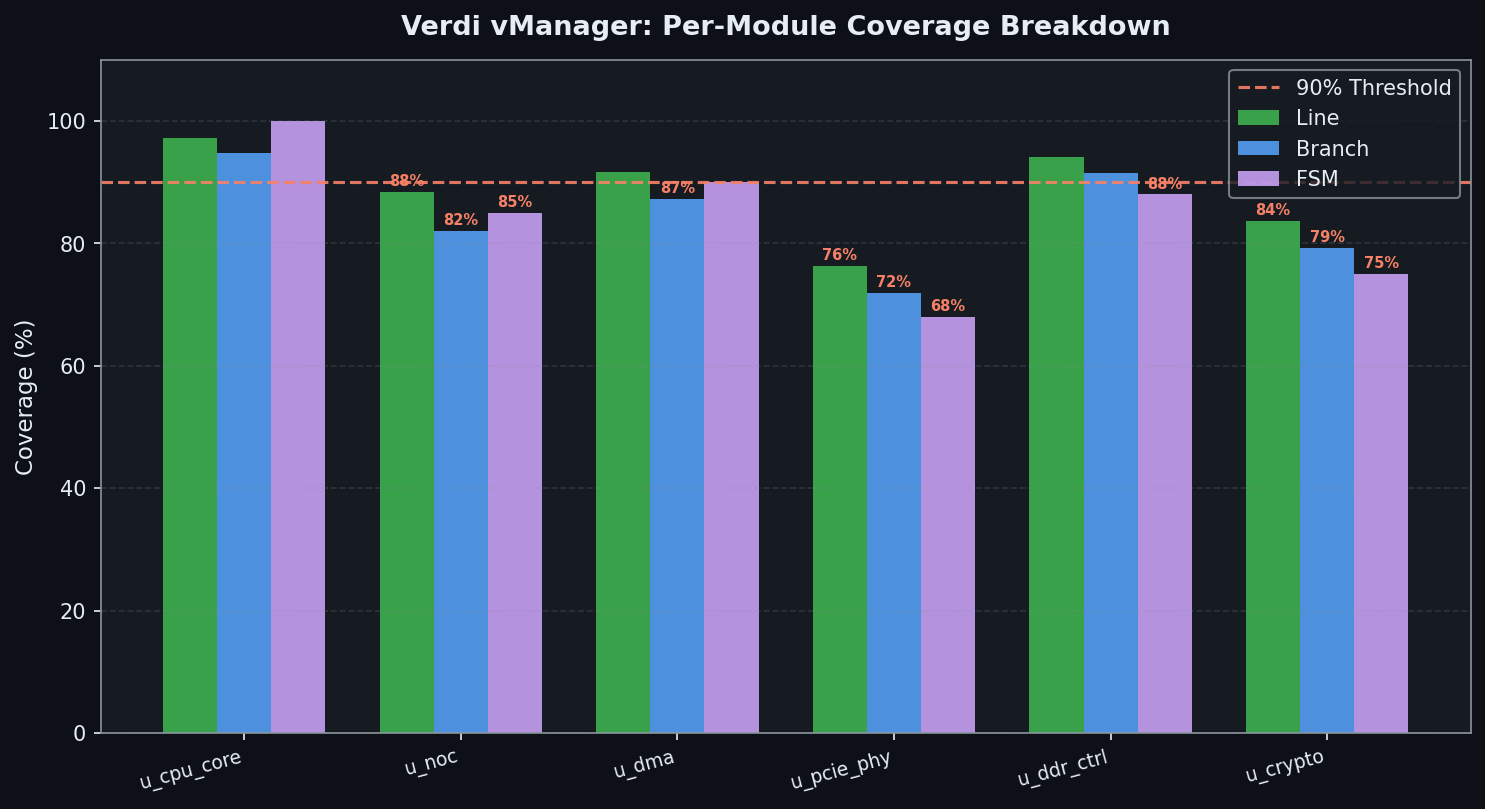
Coverage closure is rarely a single-simulator problem. Large verification environments distribute simulation across hundreds of compute farm nodes, each producing its own coverage database (.vdb file). Verdi's vManager component merges these distributed databases, computes cumulative coverage metrics, and presents a hierarchical coverage dashboard that breaks down:
- Line and branch coverage at the RTL source level
- FSM state and transition coverage with automatic state machine extraction
- Assertion coverage (SVA
coverproperties) linked directly to the assertion source - Functional coverage from SystemVerilog
covergroup/coverpointdefinitions
The dashboard supports drill-down from the top-level percentage to the specific uncovered branch or coverpoint bin, with a direct link to the corresponding source line in the integrated code viewer. Engineers can annotate uncovered items as "waived" with a justification string, and Verdi tracks these waivers across regression runs so they do not re-appear as false negatives.
Integrating Verdi with VCS for Continuous Debug
The most productive Verdi workflow pairs it with Synopsys VCS using the FSDB (Fast Signal Database) format. Unlike VCD, FSDB is a compressed, indexed binary format that supports selective signal dumping and random-access playback without loading the entire database into memory. A typical VCS invocation for Verdi-compatible output:
vcs -full64 -sverilog -debug_access+all \
    -kdb -lca \
    tb_top.sv dut.sv \
    -o simv

./simv -fsdb tb_top.fsdb +fsdb+delta
The -kdb flag enables the Kernel Debug Database, which stores elaboration information alongside the simulation results. This allows Verdi to reconstruct the complete design hierarchy, cross-probe between the schematic view and waveform, and perform SmartTrace across module boundaries — capabilities that are unavailable with plain VCD output.
For regression environments, the recommended pattern is to dump FSDB only on failure using a SystemVerilog final block:
final begin
    if (error_count > 0) begin
        $fsdbDumpvars(0, tb_top);
        $fsdbDumpfinish();
    end
end
This avoids the storage overhead of capturing waveforms for passing tests while ensuring full debug data is available for every failure.
Formal Property Debug with VC Formal Integration
Verdi's integration with Synopsys VC Formal extends its debug capabilities into the formal verification domain. When a property fails in VC Formal, the counterexample trace is automatically loaded into Verdi's waveform viewer, where SmartTrace can identify which RTL signals drove the property violation. The Formal Debug perspective adds a property table that lists all checked assertions with their proof status (proven, falsified, vacuous, or inconclusive), and engineers can filter by status, module, or clock domain.
Vacuity checking deserves particular attention: a property that is formally proven but never actually exercised its antecedent provides false confidence. Verdi flags vacuous properties and links them to the corresponding cover property that would demonstrate non-vacuity, guiding engineers toward strengthening their assertion suite.
Practical Coverage Closure Workflow
A structured coverage closure campaign in Verdi typically follows this sequence:
- Merge regression databases:
urg -dir simv.vdb -format both -report coverage_report/ - Identify low-coverage modules: Sort the module table by line coverage ascending; modules below 90% warrant immediate attention.
- Analyze uncovered branches: For each uncovered branch, use Verdi's "Show in Source" to view the RTL condition, then determine whether a directed test or a constraint relaxation in the random environment is the appropriate fix.
- Waive unreachable code: Dead code introduced by synthesis pragmas or parameter configurations should be waived with a comment referencing the design specification section that justifies the exclusion.
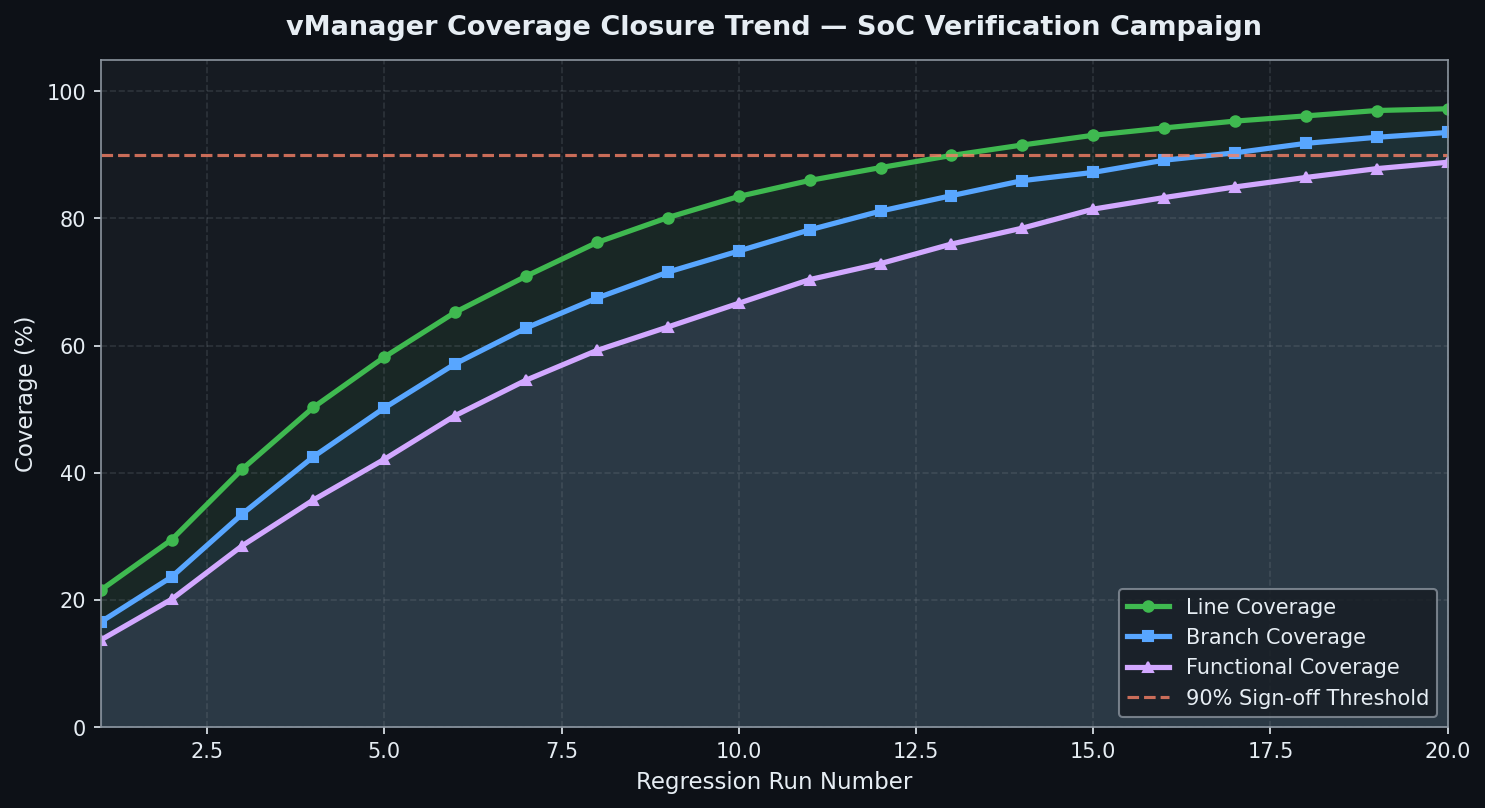
- Track closure trend: vManager's trend chart plots cumulative coverage against regression run number, making it immediately visible whether the coverage rate is converging or plateauing.
Performance Considerations
FSDB databases for large SoC simulations can reach 50–200 GB. Verdi handles this through lazy loading: only the signals currently displayed in the waveform window are loaded into memory, with additional signals fetched on demand. For designs where even selective loading is slow, the Verdi Server mode runs a persistent daemon on a high-memory machine and serves waveform data to lightweight client sessions over the network, enabling multiple engineers to debug the same simulation result simultaneously without duplicating the database in memory.
Further Resources
- Synopsys Verdi Product Page
- Synopsys VCS + Verdi Integration Application Note
- FSDB Format Technical Reference
- Synopsys VC Formal Documentation
- SystemVerilog Functional Coverage IEEE 1800-2017 Standard
Verdi has become the de facto debug environment for teams running VCS-based verification flows, and its coverage management capabilities make it equally valuable for coverage-driven verification (CDV) campaigns. For SoC teams targeting ISO 26262 ASIL-D or DO-254 Design Assurance Level A, Verdi's waiver tracking and coverage audit trail provide the documentation artifacts required by functional safety standards — making it not just a productivity tool but a compliance enabler.