
UrbanSim Land Use Forecasting: Calibrating Parcel-Level Development Models for Long-Range Planning
Urban planners and regional agencies face a persistent challenge: how do you make defensible infrastructure investment decisions 20–30 years into the future when land use patterns are shaped by thousands of individual actors responding to market signals, policy incentives, and demographic shifts? UrbanSim, an open-source urban simulation platform developed at the University of Washington and maintained by the Urban Analytics Lab, addresses this challenge by modeling land use change at the parcel or grid-cell level using econometric choice models grounded in real transaction data.
This article focuses on the calibration workflow for UrbanSim's real estate development models—a step that separates credible long-range forecasts from speculative guesswork.
What UrbanSim Models
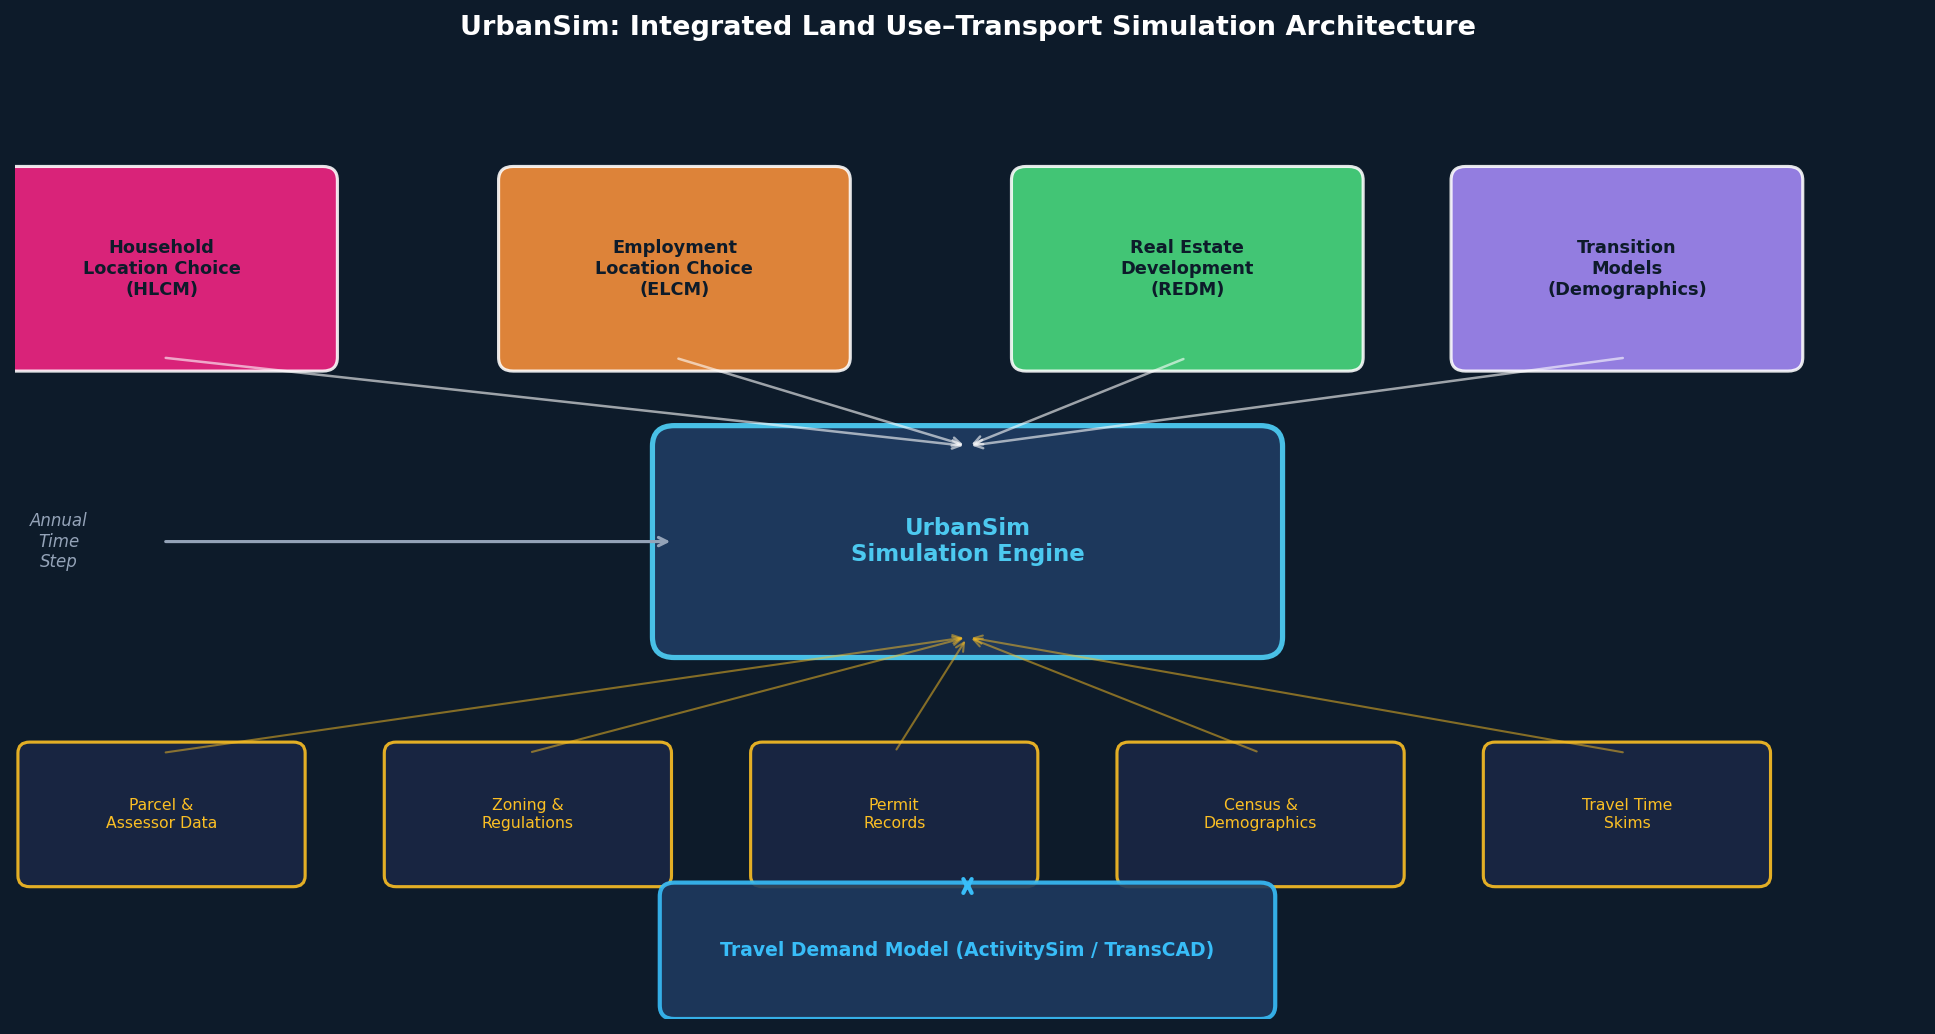
UrbanSim operates as a system of interacting sub-models that run in annual time steps:

- Household Location Choice Model (HLCM) – Predicts where households move based on accessibility, housing cost, school quality, and neighborhood characteristics.
- Employment Location Choice Model (ELCM) – Simulates firm location decisions by sector.
- Real Estate Development Model (REDM) – Determines where and what type of new construction occurs, driven by profitability signals.
- Transition Models – Control aggregate growth in households and jobs consistent with regional demographic forecasts.
The platform integrates with travel demand models (e.g., ActivitySim, BEAM) through a land use–transport feedback loop, making it a cornerstone of many Metropolitan Planning Organization (MPO) modeling stacks.
The Calibration Challenge
The REDM is the most sensitive sub-model for long-range planning because it governs where density accumulates over time. Poorly calibrated development models produce forecasts where growth concentrates in unrealistic locations—often artifacts of data gaps or misspecified profit functions.
UrbanSim's REDM uses a probit or logit regression to estimate the probability that a parcel undergoes redevelopment in a given year, based on:
- Land value to improvement value ratio (a proxy for redevelopment pressure)
- Zoning capacity (allowable FAR, height limits, unit counts)
- Accessibility metrics (distance to transit, employment centers)
- Recent nearby development activity (spatial lag variables)
Calibration requires matching the model's predicted development rates and spatial distribution against observed permit data from a historical base period—typically 10–15 years of building permit records disaggregated to the parcel level.
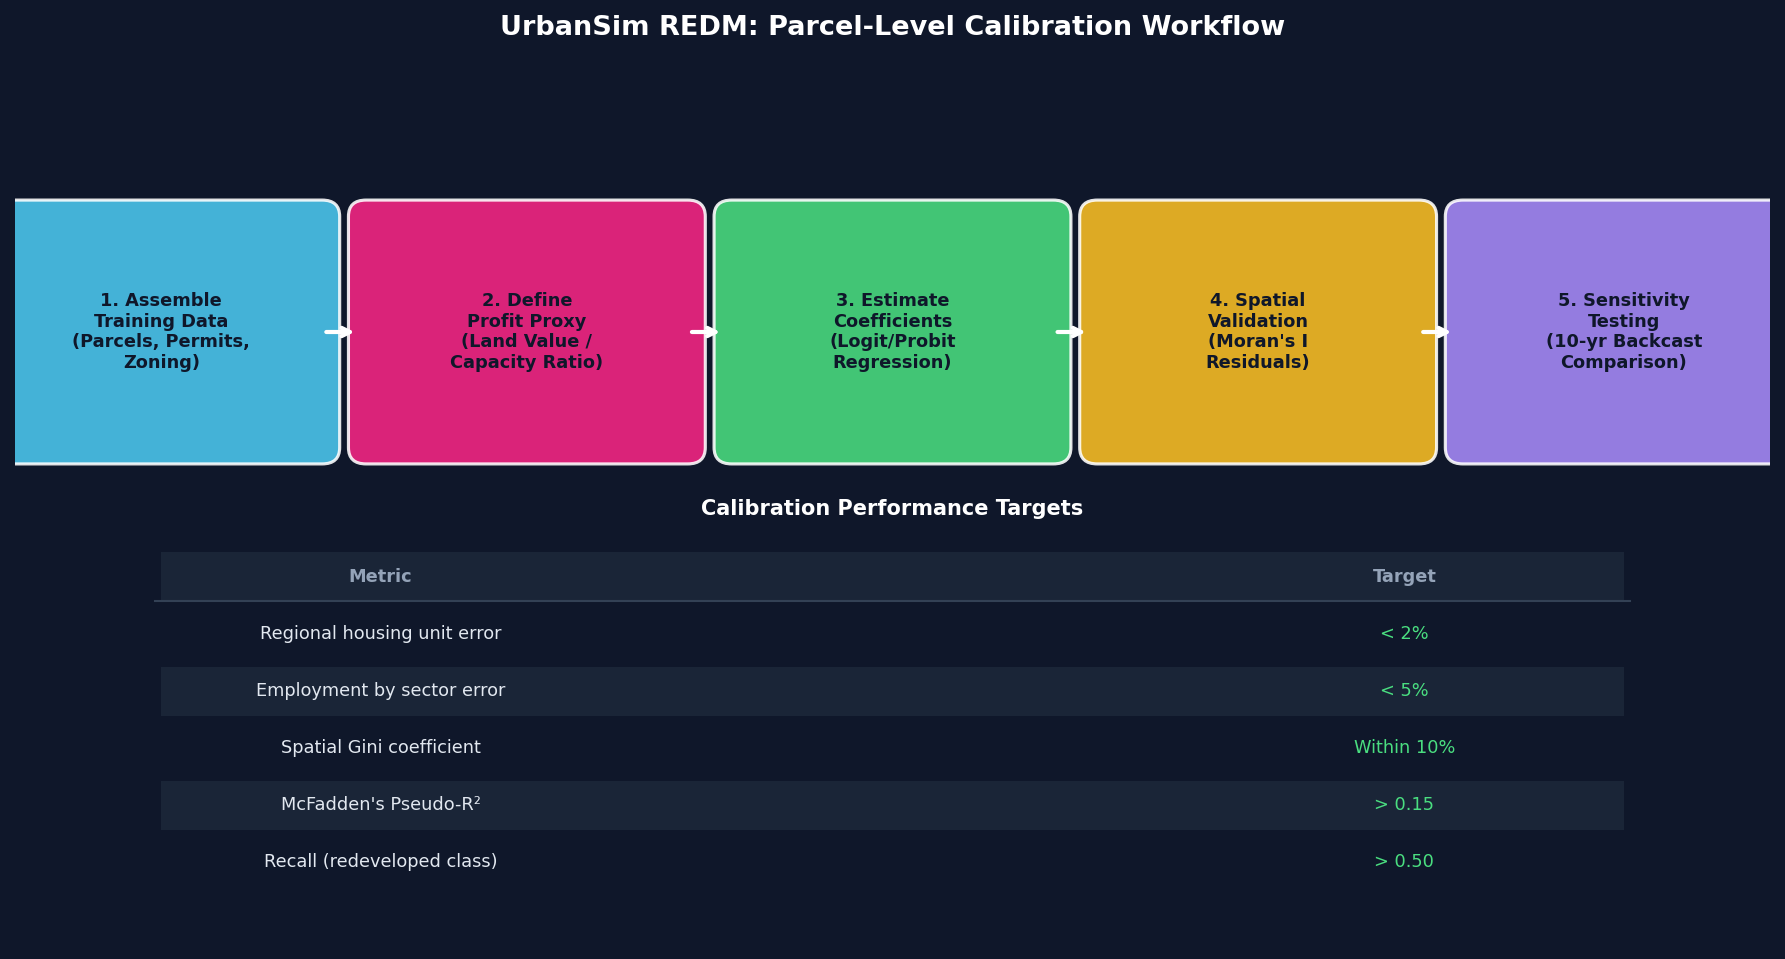
Step-by-Step Calibration Workflow
1. Assemble the Training Dataset
Pull parcel-level assessor data, building permit records, and zoning shapefiles into UrbanSim's PostgreSQL/PostGIS database. The urbansim_defaults configuration expects tables named parcels, buildings, households, jobs, and zones. Use the data_store HDF5 format for in-memory simulation runs.
# Example: load parcel data using UrbanSim's data utilities
python scripts/data_preparation/load_parcels.py --config configs/seattle_config.yaml
2. Define the Profit Proxy Variable
The REDM's core signal is whether redevelopment is financially viable. A common proxy is:
profit_proxy = (land_value / (land_value + improvement_value)) * zoning_capacity_ratioWhere zoning_capacity_ratio = allowable_sqft / existing_sqft. Parcels with ratios above 1.5 and land value fractions above 0.6 are strong redevelopment candidates. Validate this against your permit data before proceeding.
3. Estimate Model Coefficients
UrbanSim uses statsmodels or sklearn under the hood for coefficient estimation. Run the estimation script against your historical period:
from urbansim.models import RegressionModel

model = RegressionModel.from_yaml('configs/redm_config.yaml')
model.fit(data=parcels_df, outcome_col='redeveloped')
model.to_yaml('configs/redm_calibrated.yaml')
print(model.fit_parameters)
Examine the pseudo-R² (McFadden's) and the confusion matrix at a 0.15 probability threshold. A pseudo-R² above 0.15 and a recall above 0.50 for the redeveloped class are reasonable targets for parcel-level models given the rarity of redevelopment events.
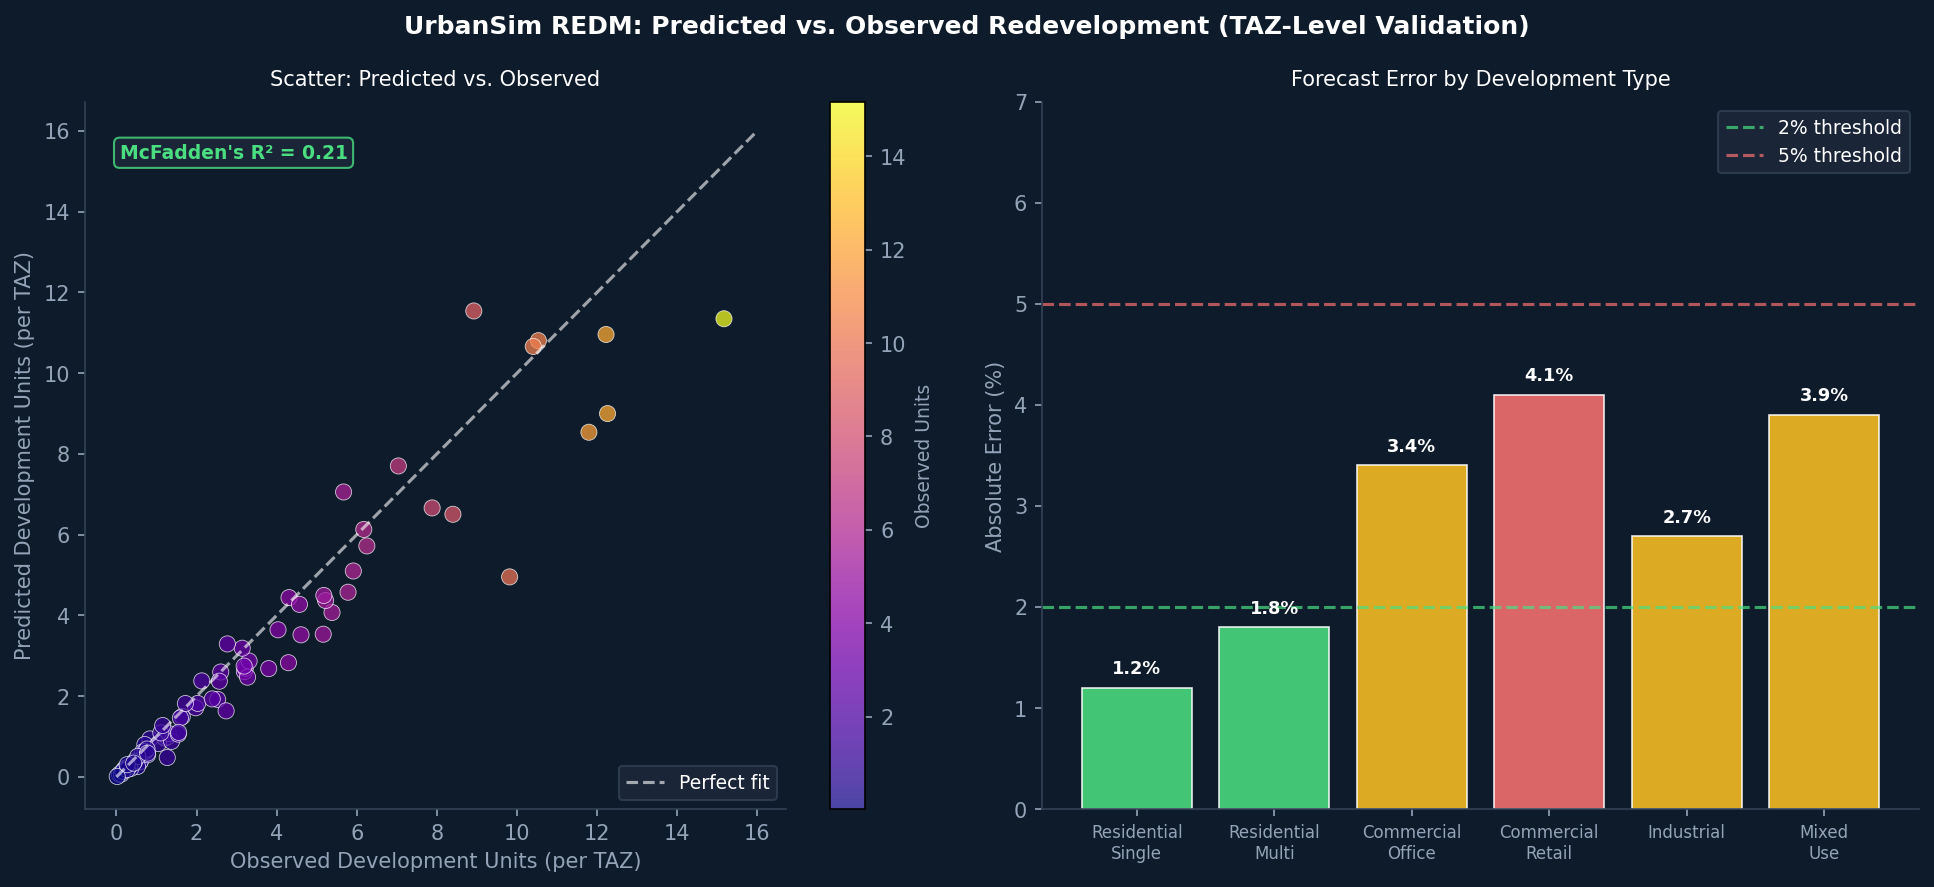
4. Spatial Validation
Aggregate predicted development to the TAZ (Traffic Analysis Zone) or census tract level and compare against observed permit counts using a spatial autocorrelation diagnostic (Moran's I). Significant positive autocorrelation in residuals indicates missing spatial variables—consider adding distance to recent development clusters or neighborhood fixed effects.
5. Sensitivity Testing
Run the calibrated model forward 10 years using known historical inputs and compare the simulated 2015 land use pattern against the actual 2015 assessor snapshot. Key metrics:
| Metric | Target |
|---|---|
| Regional housing unit count error | < 2% |
| Employment by sector error | < 5% |
| Spatial Gini coefficient of development | Within 10% of observed |
Integration with Regional Travel Demand Models
UrbanSim's outputs—household and employment distributions by zone—feed directly into ActivitySim or TransCAD as zone-level socioeconomic data (SE data). The feedback loop runs as follows:
- UrbanSim generates land use for year t
- Travel model produces accessibility skims (travel times, costs)
- Accessibility skims update UrbanSim's location choice utilities for year t+1
This feedback is critical for transit-oriented development scenarios: without it, the model cannot capture how a new light rail station changes nearby land values and attracts higher-density development.
Practical Considerations for MPO Deployments
- Data vintage matters: Assessor data lags actual construction by 1–2 years. Supplement with permit data for recent years.
- Zoning data quality: Inconsistent zoning codes across jurisdictions are the most common calibration failure point. Invest in a unified zoning schema before model estimation.
- Computational scale: A full Bay Area run (~2.5 million parcels, 30-year horizon) requires approximately 8–12 hours on a 32-core server. Use UrbanSim's
multiprocessingconfiguration to parallelize location choice models. - Version control your configs: Store all YAML configuration files in Git. Scenario management across policy alternatives (upzoning, carbon pricing, infrastructure investment) is far easier with version-controlled configs.
Further Resources
- UrbanSim GitHub Repository – Source code, documentation, and example datasets
- Urban Analytics Lab – Research papers and case studies from MPO deployments
- ActivitySim Integration Guide – Documentation for the land use–transport feedback loop
- PSRC UrbanSim Implementation – Puget Sound Regional Council's production deployment documentation
- UrbanSim Users Group – Community forum for calibration questions and data sharing
UrbanSim's parcel-level approach demands more data preparation effort than aggregate land use models, but it pays dividends in scenario specificity: planners can test the effect of rezoning a single corridor, changing parking minimums, or introducing an inclusionary housing requirement—and see how those changes propagate through the regional land use–transport system over decades. For agencies willing to invest in calibration rigor, it remains one of the most defensible tools available for long-range planning.