
PowerWorld Simulator: Contingency Analysis and Voltage Stability Assessment for Transmission Planning
PowerWorld Simulator is a high-performance interactive power systems analysis platform widely used by transmission planners, independent system operators (ISOs), and utility engineers. While many tools in the energy simulation space focus on distribution-level or production-cost modeling, PowerWorld occupies a distinct niche: large-scale transmission network visualization, contingency screening, and voltage stability assessment. This article examines two of its most operationally critical capabilities—N-1/N-2 contingency analysis and PV/QV curve generation—and explains how practitioners can leverage them for robust transmission planning studies.
Why Contingency Analysis Matters in Transmission Planning
Modern power grids must remain stable and within thermal limits even after the sudden loss of any single element (N-1 criterion) or, in some jurisdictions, any two elements simultaneously (N-2). NERC Reliability Standards TPL-001 through TPL-004 mandate that utilities demonstrate compliance with these criteria across a range of planning events. Manually evaluating thousands of contingencies across a large interconnected network is computationally prohibitive without purpose-built tooling.
PowerWorld's Contingency Analysis (CA) module automates this process. Users define contingency sets—ranging from simple line outages to complex generator-plus-transformer trips—and the solver evaluates each case using a full AC power flow or a linearized DC approximation, depending on the required fidelity and speed trade-off.

Setting Up a Contingency Study in PowerWorld
A typical contingency workflow in PowerWorld proceeds as follows:
- Load the base case: Import a PSS/E
.rawfile or a PowerWorld.pwbcase. Ensure the base case converges and all monitored elements are within limits. - Define the contingency list: Use the Contingency Analysis dialog to auto-generate N-1 contingencies for all transmission lines and transformers, or import a pre-defined list via CSV. For N-2 studies, PowerWorld supports combinatorial generation with user-defined filters to limit the search space.
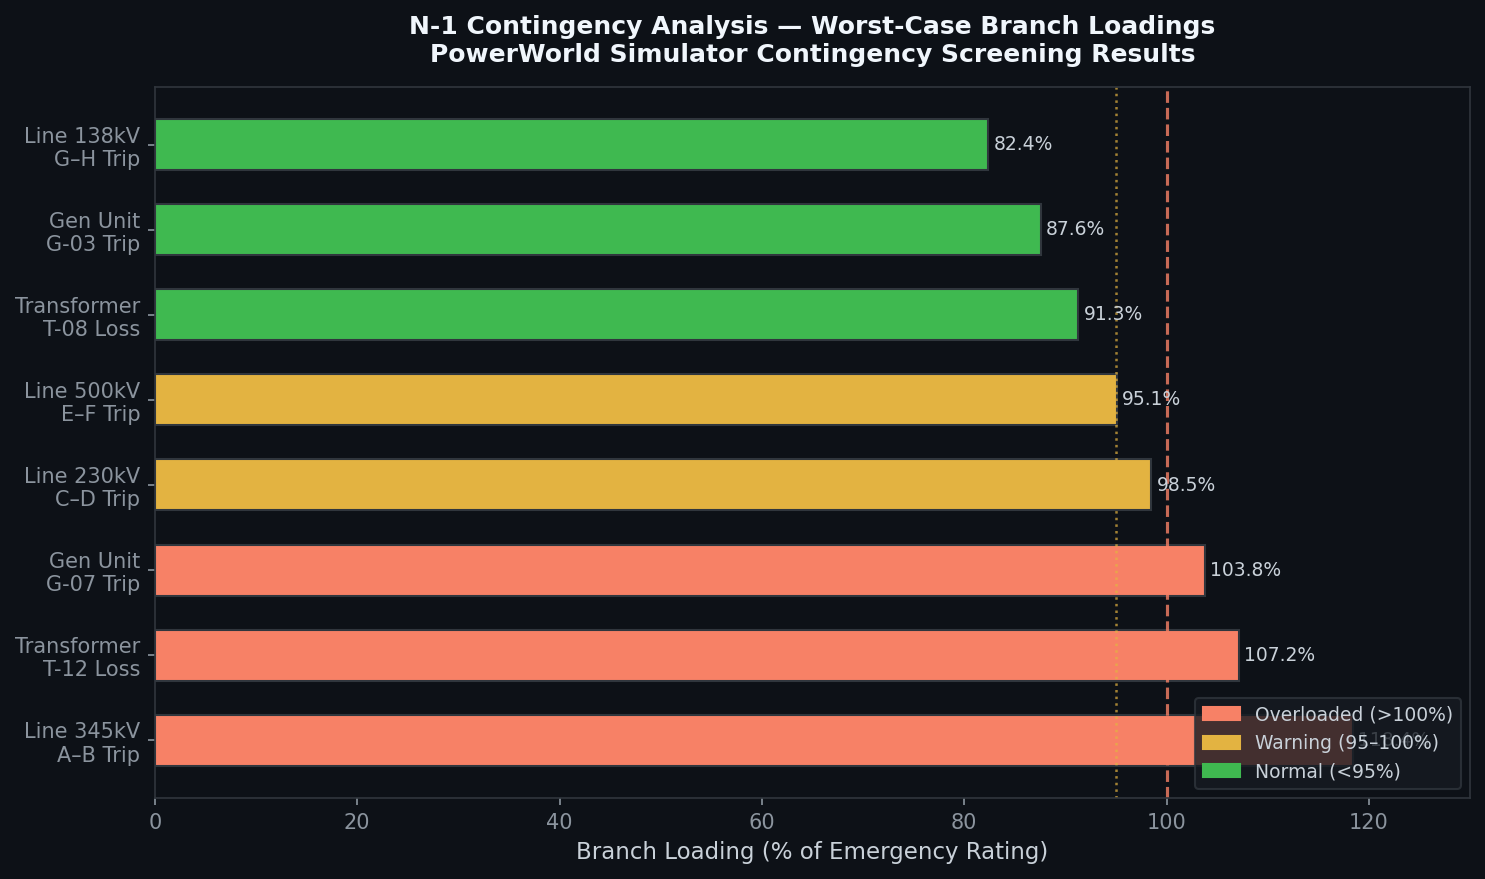
- Configure limit monitors: Specify which branches, buses, and interfaces to monitor for overloads and voltage violations. PowerWorld allows percentage-based overload thresholds (e.g., flag any element exceeding 100% of its emergency rating).
- Select the solution method: For large systems (>5,000 buses), the Fast Decoupled or DC approximation provides rapid screening. Switch to full Newton-Raphson AC for cases flagged as potentially problematic.
- Run and filter results: After execution, the results table highlights violations. The built-in Contingency Filter lets engineers sort by severity, isolate voltage violations below 0.95 p.u., or identify the worst-case loading on a specific corridor.
PowerWorld's one-line diagram updates in real time during contingency playback, making it straightforward to visualize power redistribution and identify overloaded parallel paths—a capability that distinguishes it from purely text-based solvers.
Voltage Stability Assessment with PV and QV Curves
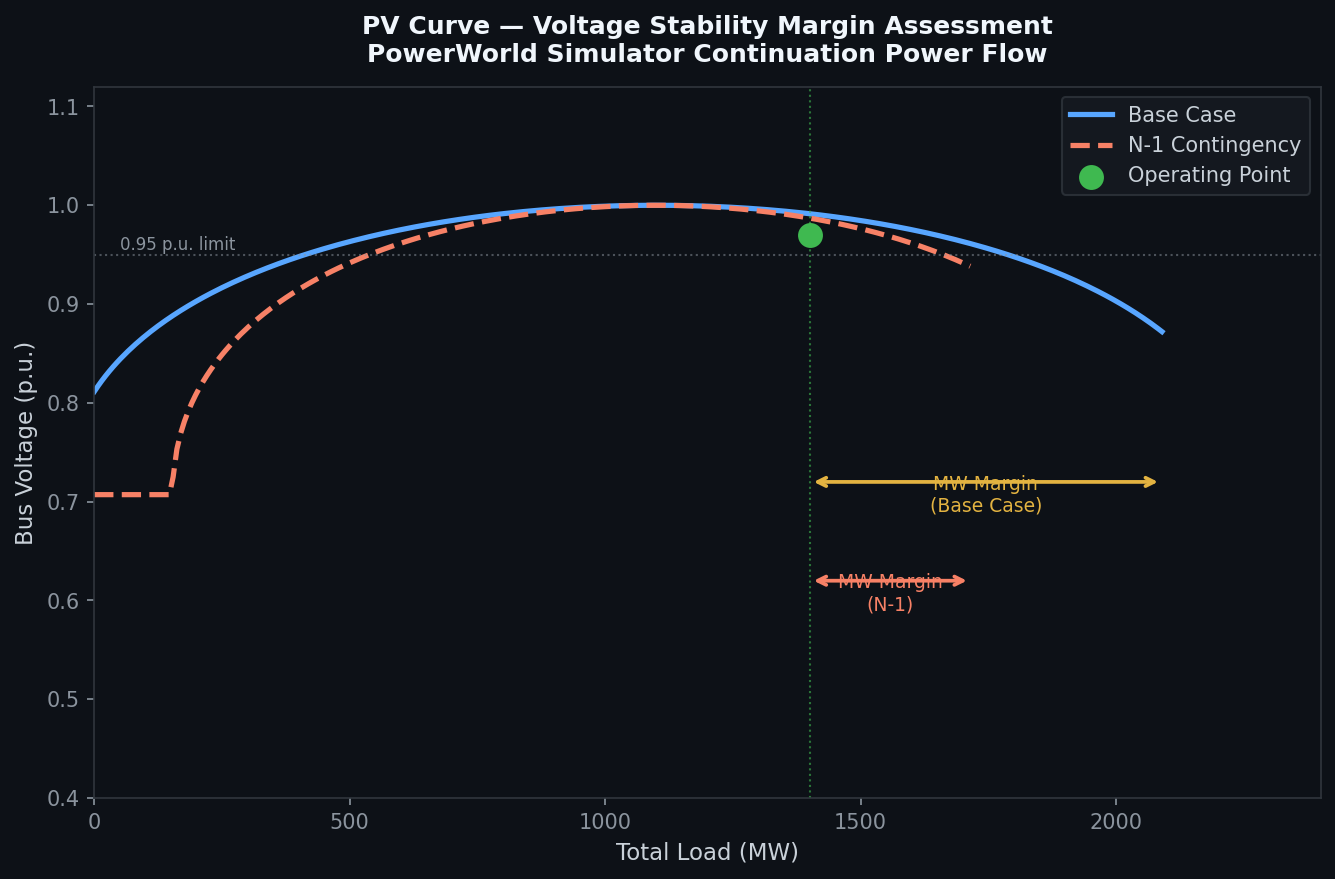
Beyond thermal limits, voltage collapse is a critical concern in heavily loaded transmission corridors. PowerWorld's Voltage Stability toolset generates PV curves (power vs. voltage at a load bus) and QV curves (reactive power vs. voltage) to quantify voltage stability margins.
Generating a PV Curve
The PV curve traces the voltage at a monitored bus as system load is incrementally increased along a defined load-increase direction (the "stress direction"). PowerWorld uses a continuation power flow (CPF) algorithm that automatically adjusts the step size near the nose point—where the Jacobian becomes singular—to avoid divergence. Key parameters include:
- Stress direction: Define which loads increase and which generators pick up the slack (e.g., a specific import interface).
- Monitored bus: Typically the weakest bus in the study area, identified from prior contingency screening.
- Contingency overlay: PowerWorld can superimpose PV curves for the base case and selected contingencies on the same plot, immediately revealing how much the stability margin shrinks post-contingency.
The MW margin—the distance from the current operating point to the nose point—is the primary deliverable. NERC and regional transmission organizations (RTOs) typically require a minimum margin of 5–10% above the most severe single contingency.
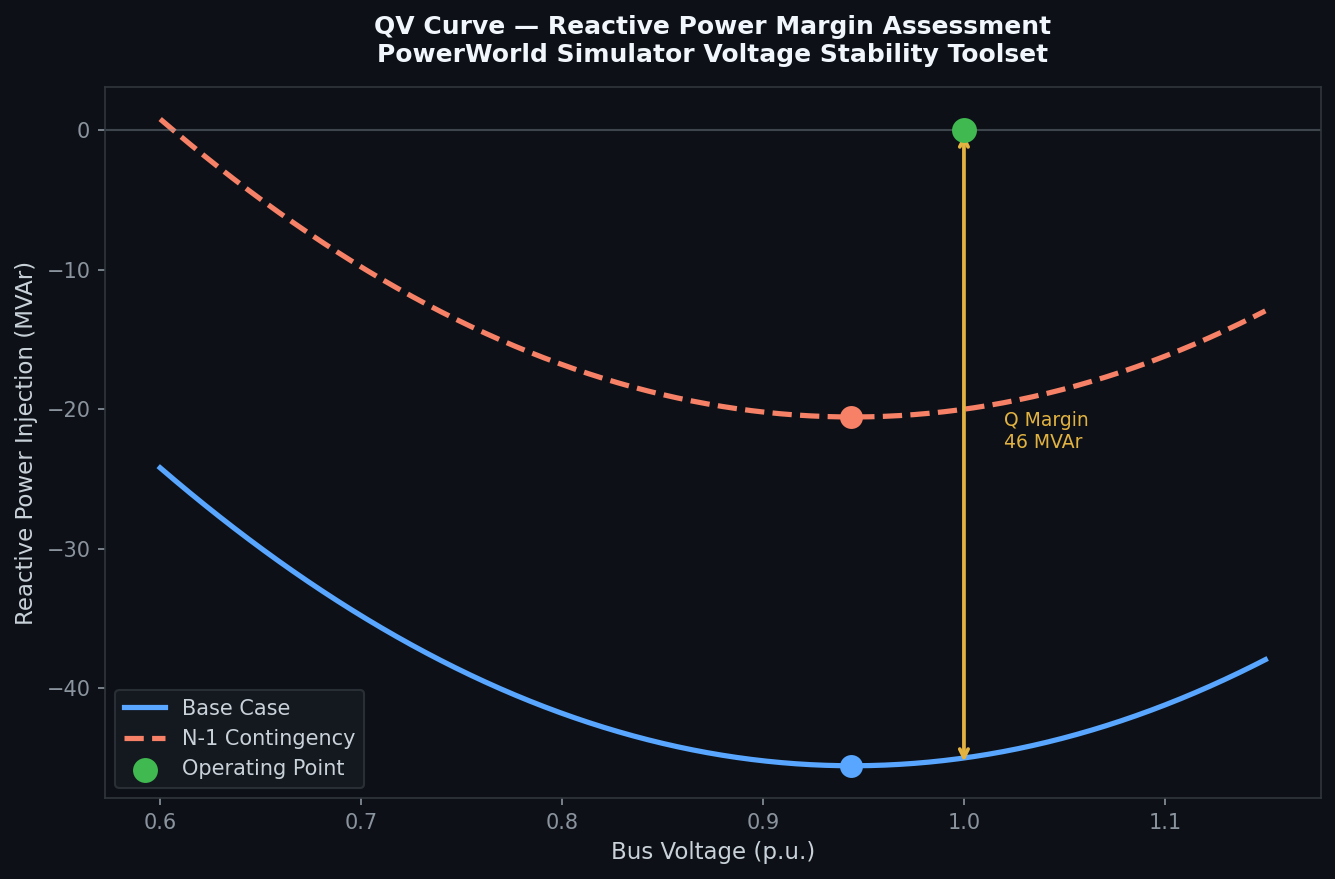
Generating a QV Curve
QV curves assess reactive power reserve at a bus. PowerWorld injects or absorbs reactive power at the study bus while holding all other system conditions fixed, plotting the resulting voltage. The minimum of the QV curve (the point where dQ/dV = 0) defines the reactive power margin. A positive margin indicates stability; a negative margin signals that the bus is already operating beyond its reactive capability.
QV analysis is particularly valuable for siting new reactive compensation (capacitor banks, STATCOMs, or synchronous condensers). By overlaying QV curves before and after adding a proposed STATCOM, planners can directly quantify the improvement in reactive margin.
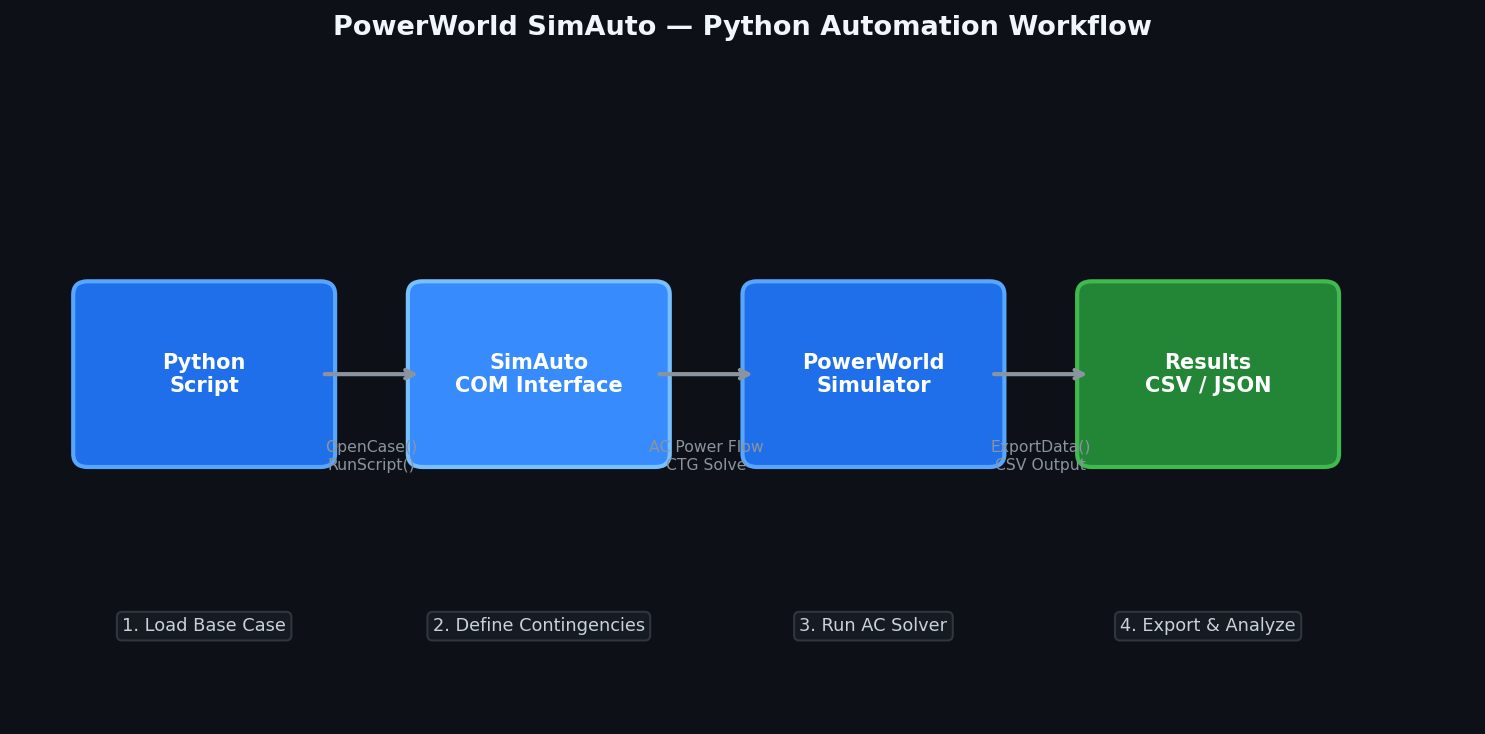
Scripting and Automation with PowerWorld's SimAuto COM Interface
For large planning studies requiring hundreds of contingency-plus-stability runs, PowerWorld exposes a COM automation interface (SimAuto) that can be driven from Python, MATLAB, or VBA. A minimal Python workflow using the win32com library looks like:
import win32com.client

pw = win32com.client.Dispatch("pwrworld.SimulatorAuto")
pw.OpenCase(r"C:\Studies\base_case.pwb")
pw.RunScriptCommand("EnterMode(EDIT)")
pw.RunScriptCommand("SolvePowerFlow(RECTNEWT)")

# Run contingency analysis and export results
pw.RunScriptCommand("CTGSolveAll")
pw.RunScriptCommand('ExportData("CONTINGENCY", "CSV", "C:\\Results\\ctg_results.csv", YES)')
pw.CloseCase()
SimAuto enables integration with broader planning workflows—for example, automatically running stability assessments for each year of a 10-year load forecast, or coupling PowerWorld results with a Python-based economic dispatch model.
Practical Considerations and Limitations
- Licensing: PowerWorld Simulator is commercial software. The Glover-Sarma educational edition supports up to 13 buses; full transmission-scale licenses are required for production studies.
- Model fidelity: PowerWorld's dynamic simulation capabilities (transient stability) are less mature than dedicated tools like PSS®E or PowerFactory. For detailed generator control modeling, consider using PowerWorld for steady-state screening and a dedicated dynamic simulator for follow-on studies.
- Interoperability: PowerWorld reads and writes PSS/E RAW and DYR formats, facilitating data exchange with other tools in the planning workflow.
- Parallel processing: The contingency solver supports multi-threaded execution, but performance scales best on systems with high single-core clock speeds rather than high core counts, due to the sequential nature of AC power flow convergence.
Further Resources
- PowerWorld Simulator Official Documentation
- NERC TPL Reliability Standards
- PowerWorld SimAuto Python Examples (GitHub) — the open-source Easy SimAuto (ESA) library provides a Pythonic wrapper around the COM interface
- Voltage Stability Assessment Methods — IEEE PES Technical Report
PowerWorld Simulator remains one of the most capable and visually intuitive platforms for transmission-level contingency and voltage stability work. Its combination of interactive one-line visualization, robust continuation power flow, and COM-based automation makes it a practical choice for both day-to-day planning studies and large-scale interconnection assessments.